

Synthesis of HA–Collagen and HA–Collagen–Alginate Nanocomposites
715
Peaks 1632, 2920, and 333 cm
−1 in the spectrum of the collagen sample indicate
the presence of the characteristic for collagen functional groups –CO (amide I),
–CH 2 –, –NH (amide A), respectively [16]. However, in the HA–collagen sample,
there are no peaks corresponding to collagen, which is, in our opinion, due to the
chemical binding of hydroxyapatite with these groups.
2.6 Raman
Raman spectra for the determination of phase components were recorded in the range
100–1200 cm
−1 using a three-stage Raman spectrometer T64000 (Horiba, Japan)
with an Ar–Kr laser (Stabilite 2018-RM Spectra-Physics, USA). The excitation laser
was operated at 488 nm (1 mW).
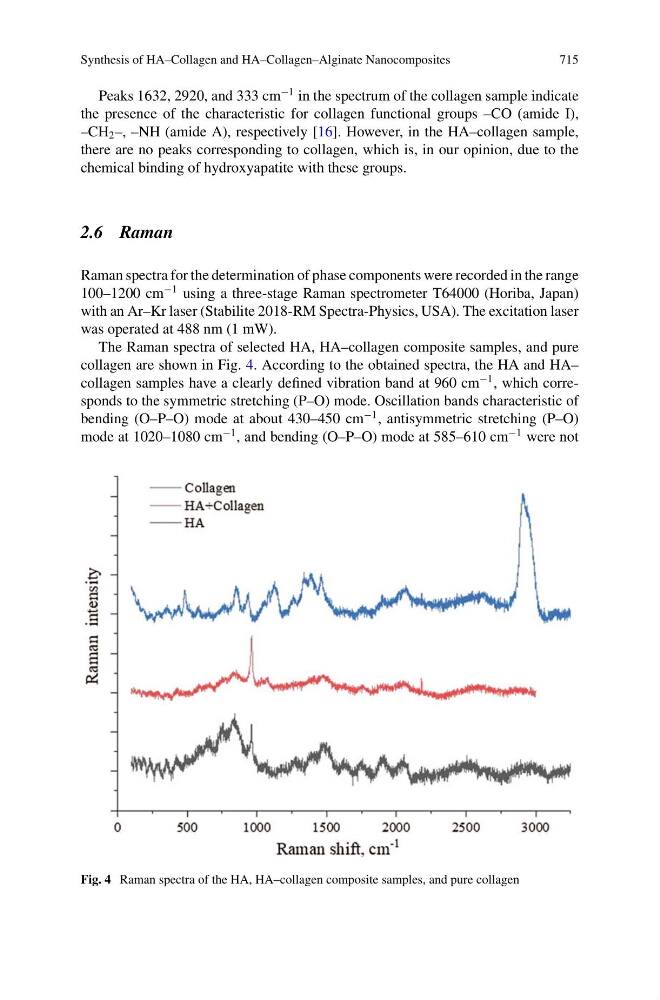
The Raman spectra of selected HA, HA–collagen composite samples, and pure
collagen are shown in Fig. 4. According to the obtained spectra, the HA and HA–
collagen samples have a clearly defined vibration band at 960 cm
−1 , which corresponds to the symmetric stretching (P–O) mode. Oscillation bands characteristic of
bending (O–P–O) mode at about 430–450 cm
−1 , antisymmetric stretching (P–O)
mode at 1020–1080 cm
−1 , and bending (O–P–O) mode at 585–610 cm
−1 were not
Fig. 4 Raman spectra of the HA, HA–collagen composite samples, and pure collagen