

692
K. Ivanenko et al.
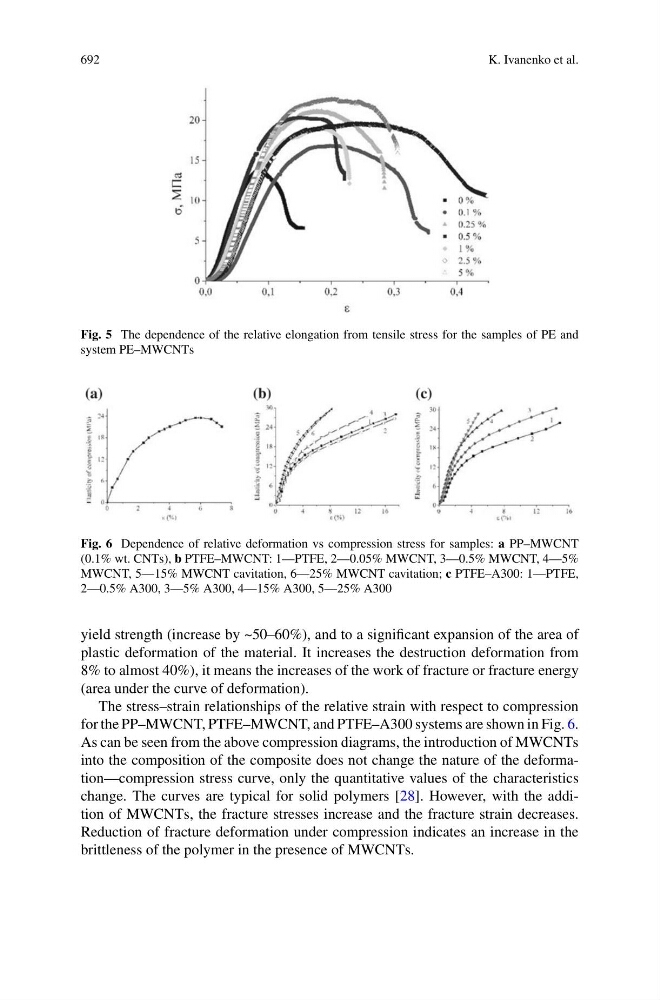
Fig. 5 The dependence of the relative elongation from tensile stress for the samples of PE and
system PE–MWCNTs
Fig. 6 Dependence of relative deformation vs compression stress for samples: a PP–MWCNT
(0.1% wt. CNTs), b PTFE–MWCNT: 1—PTFE, 2—0.05% MWCNT, 3—0.5% MWCNT, 4—5%
MWCNT, 5—15% MWCNT cavitation, 6—25% MWCNT cavitation; c PTFE–A300: 1—PTFE,
2—0.5% A300, 3—5% A300, 4—15% A300, 5—25% A300
yield strength (increase by ~50–60%), and to a significant expansion of the area of
plastic deformation of the material. It increases the destruction deformation from
8% to almost 40%), it means the increases of the work of fracture or fracture energy
(area under the curve of deformation).
The stress–strain relationships of the relative strain with respect to compression
for the PP–MWCNT, PTFE–MWCNT, and PTFE–A300 systems are shown in Fig. 6.
As can be seen from the above compression diagrams, the introduction of MWCNTs
into the composition of the composite does not change the nature of the deformation—compression stress curve, only the quantitative values of the characteristics
change. The curves are typical for solid polymers [28]. However, with the addition of MWCNTs, the fracture stresses increase and the fracture strain decreases.
Reduction of fracture deformation under compression indicates an increase in the
brittleness of the polymer in the presence of MWCNTs.