

690
K. Ivanenko et al.
Percolation theory is most often used for the analytical description of conductivity
dependences on filler concentration [22, 23]. The framework of the probability of
the formation of clusters of particles in contact with each other is considered. The
description of the critical electric current flow in composite materials (CM) is given by
means of the percolation problem formulated for a continuous medium. According to
this problem, each point of space with probability p = θ F corresponds to conductivity
σ = σ F and with probability (1–p)—conductivity σ = σ m . The threshold in the
percolation terms means the filler concentration at which the phase transition of the
second kind of dielectric-conductor occurs. In this case, in the composite system,
the regions with high conductivity occupy a minimum fraction of the space—θ F . At
small p, all conductive elements are contained in the isolated clusters of finite size.
With increasing p, the average size of clusters increases and at p = θ F , a through
conduction channel, i.e., a continuous grid of conducting clusters, appears in the
system for the first time. At high p values, nonconducting regions may already be
isolated from each other.
Based on the percolation theory, the following expressions are obtained to describe
the dependence of electrical conductivity on the filler concentration [22, 23]:
σ ∼ σ F (θ − θ F )
t
, θ > θ F ,
σ ∼ σ m (θ F − θ)
q
, θ < θ F ,
(1)
where t, q—critical indices of percolation theory.
For a three-dimensional model of a composite material with the spherical filler
particles in the percolation theory, the following values of the threshold and critical
indices are obtained: θ F = 17% vol., t = 1.6…1.9, q = 1. In practice, significant
deviations from the theoretically calculated values are possible. For example, for the
graphite–polystyrene system [24] θ F = 2% vol., t = 0.35; for the carbon black–
polyvinyl chloride system, the authors [25] obtained θ F = 11% wt., and the authors
[26]—9…9.5% wt. at t = 1.9 ± 0.2, and the authors [21] for the PE–CNTs system
obtained the value θ F = 0.07% wt. at t = 2.1.
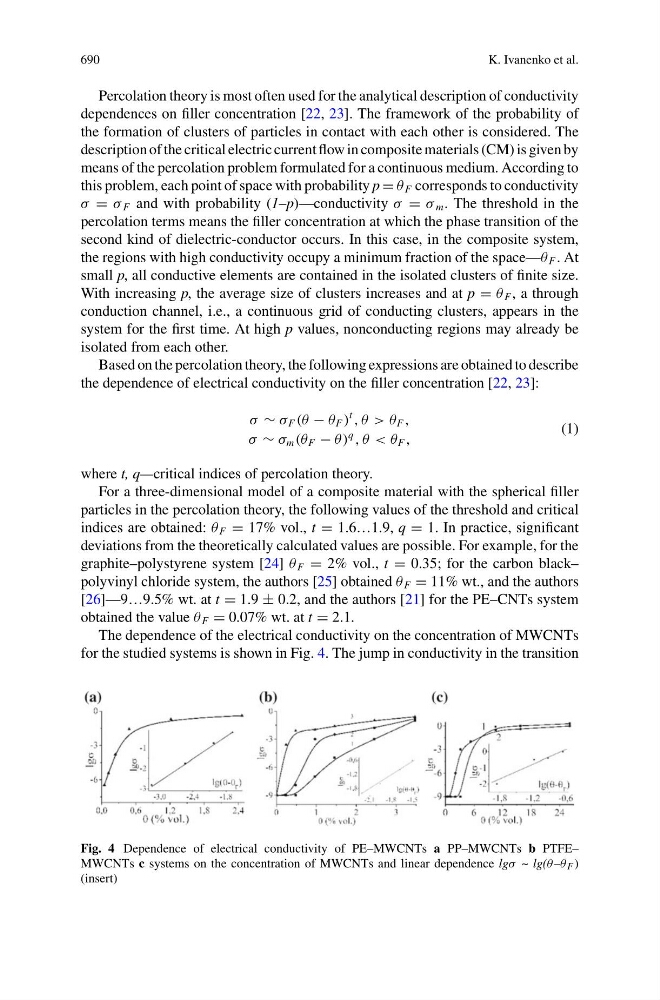
The dependence of the electrical conductivity on the concentration of MWCNTs
for the studied systems is shown in Fig. 4. The jump in conductivity in the transition
Fig. 4 Dependence of electrical conductivity of PE–MWCNTs a PP–MWCNTs b PTFE–
MWCNTs c systems on the concentration of MWCNTs and linear dependence lgσ ~ lg(θ–θ F )
(insert)