

Influence of the Carbon Allotropes on Dilatometric Properties …
673
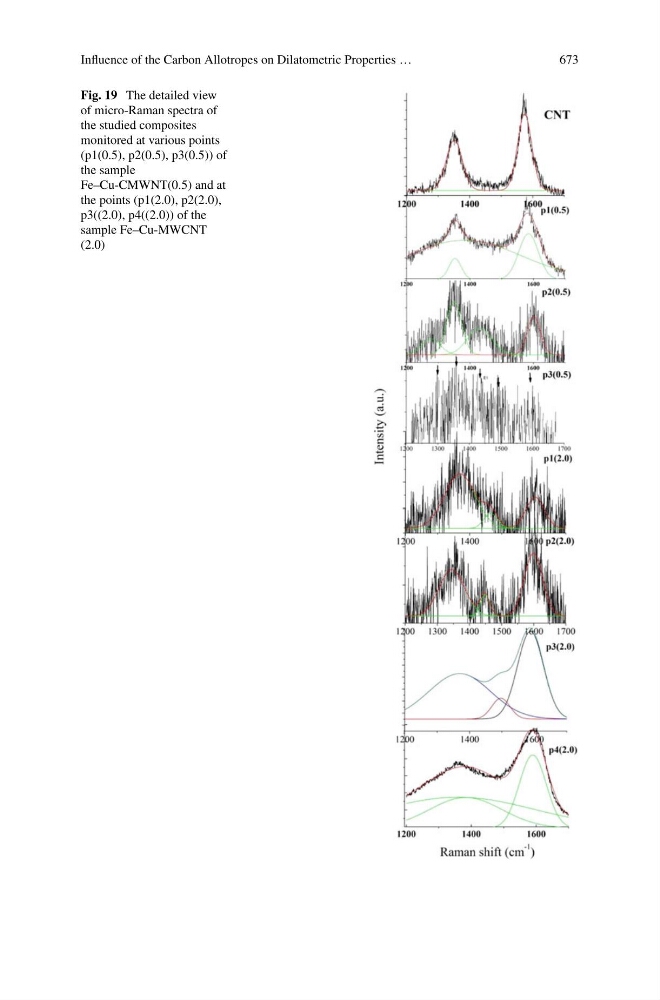
Fig. 19 The detailed view
of micro-Raman spectra of
the studied composites
monitored at various points
(p1(0.5), p2(0.5), p3(0.5)) of
the sample
Fe–Cu-CMWNT(0.5) and at
the points (p1(2.0), p2(2.0),
p3((2.0), p4((2.0)) of the
sample Fe–Cu-MWCNT
(2.0)
673
Fig. 19 The detailed view
of micro-Raman spectra of
the studied composites
monitored at various points
(p1(0.5), p2(0.5), p3(0.5)) of
the sample
Fe–Cu-CMWNT(0.5) and at
the points (p1(2.0), p2(2.0),
p3((2.0), p4((2.0)) of the
sample Fe–Cu-MWCNT
(2.0)