

672
M. C. Bouleklab et al.
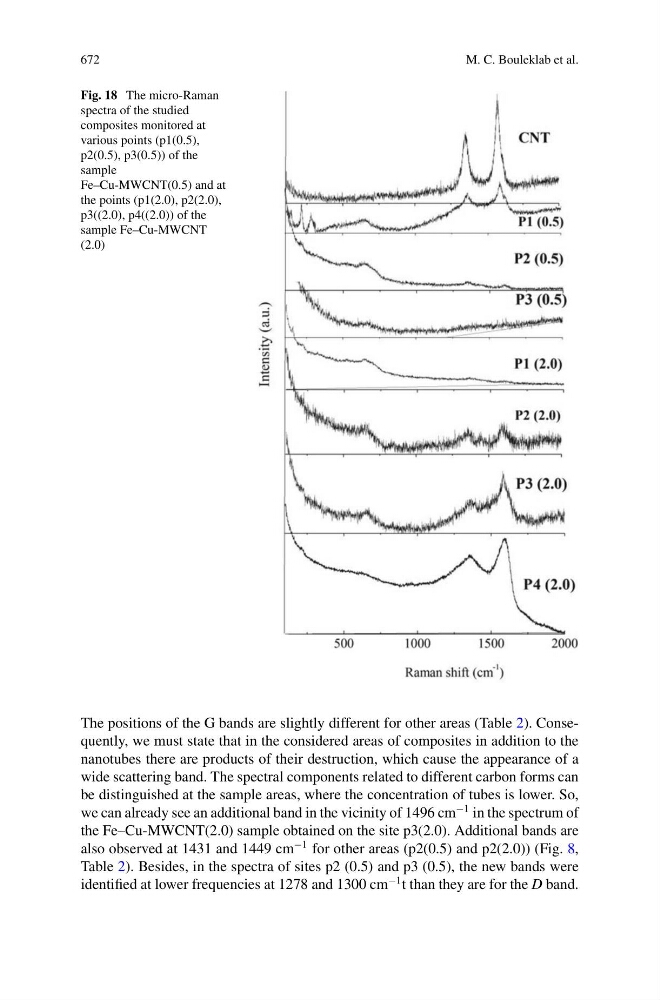
Fig. 18 The micro-Raman
spectra of the studied
composites monitored at
various points (p1(0.5),
p2(0.5), p3(0.5)) of the
sample
Fe–Cu-MWCNT(0.5) and at
the points (p1(2.0), p2(2.0),
p3((2.0), p4((2.0)) of the
sample Fe–Cu-MWCNT
(2.0)
The positions of the G bands are slightly different for other areas (Table 2). Consequently, we must state that in the considered areas of composites in addition to the
nanotubes there are products of their destruction, which cause the appearance of a
wide scattering band. The spectral components related to different carbon forms can
be distinguished at the sample areas, where the concentration of tubes is lower. So,
we can already see an additional band in the vicinity of 1496 cm
−1 in the spectrum of
the Fe–Cu-MWCNT(2.0) sample obtained on the site p3(2.0). Additional bands are
also observed at 1431 and 1449 cm
−1 for other areas (p2(0.5) and p2(2.0)) (Fig. 8,
Table 2). Besides, in the spectra of sites p2 (0.5) and p3 (0.5), the new bands were
identified at lower frequencies at 1278 and 1300 cm
−1 t than they are for the D band.