

Influence of the Carbon Allotropes on Dilatometric Properties …
665
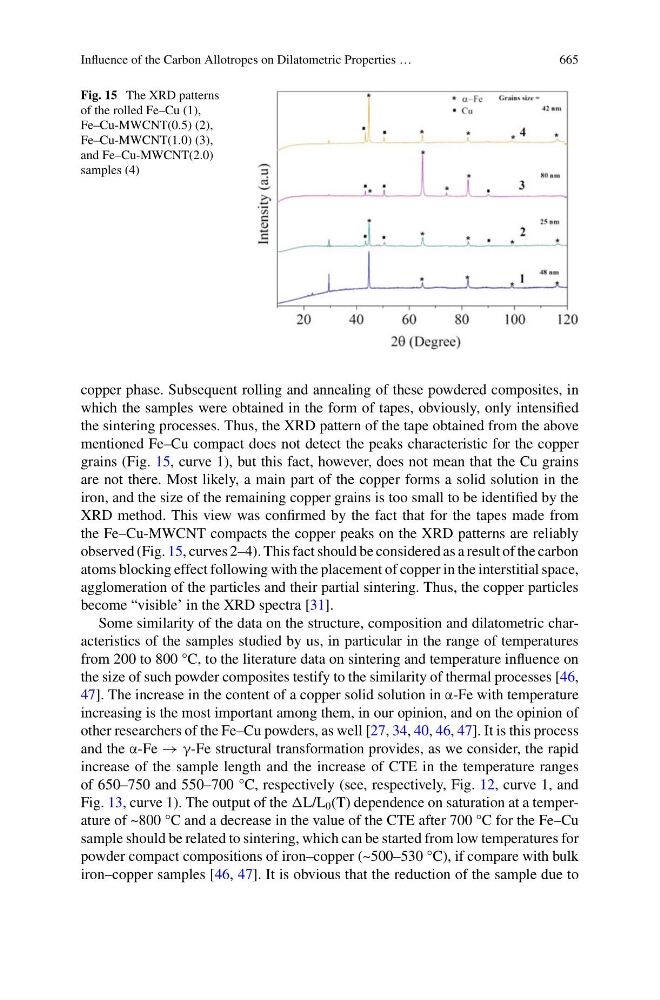
Fig. 15 The XRD patterns
of the rolled Fe–Cu (1),
Fe–Cu-MWCNT(0.5) (2),
Fe–Cu-MWCNT(1.0) (3),
and Fe–Cu-MWCNT(2.0)
samples (4)
copper phase. Subsequent rolling and annealing of these powdered composites, in
which the samples were obtained in the form of tapes, obviously, only intensified
the sintering processes. Thus, the XRD pattern of the tape obtained from the above
mentioned Fe–Cu compact does not detect the peaks characteristic for the copper
grains (Fig. 15, curve 1), but this fact, however, does not mean that the Cu grains
are not there. Most likely, a main part of the copper forms a solid solution in the
iron, and the size of the remaining copper grains is too small to be identified by the
XRD method. This view was confirmed by the fact that for the tapes made from
the Fe–Cu-MWCNT compacts the copper peaks on the XRD patterns are reliably
observed (Fig. 15, curves 2–4). This fact should be considered as a result of the carbon
atoms blocking effect following with the placement of copper in the interstitial space,
agglomeration of the particles and their partial sintering. Thus, the copper particles
become “visible’ in the XRD spectra [31].
Some similarity of the data on the structure, composition and dilatometric characteristics of the samples studied by us, in particular in the range of temperatures
from 200 to 800 °C, to the literature data on sintering and temperature influence on
the size of such powder composites testify to the similarity of thermal processes [46,
47]. The increase in the content of a copper solid solution in α-Fe with temperature
increasing is the most important among them, in our opinion, and on the opinion of
other researchers of the Fe–Cu powders, as well [27, 34, 40, 46, 47]. It is this process
and the α-Fe → γ-Fe structural transformation provides, as we consider, the rapid
increase of the sample length and the increase of CTE in the temperature ranges
of 650–750 and 550–700 °C, respectively (see, respectively, Fig. 12, curve 1, and
Fig. 13, curve 1). The output of the L/L 0 (T) dependence on saturation at a temperature of ~800 °C and a decrease in the value of the CTE after 700 °C for the Fe–Cu
sample should be related to sintering, which can be started from low temperatures for
powder compact compositions of iron–copper (~500–530 °C), if compare with bulk
iron–copper samples [46, 47]. It is obvious that the reduction of the sample due to