

656
M. C. Bouleklab et al.
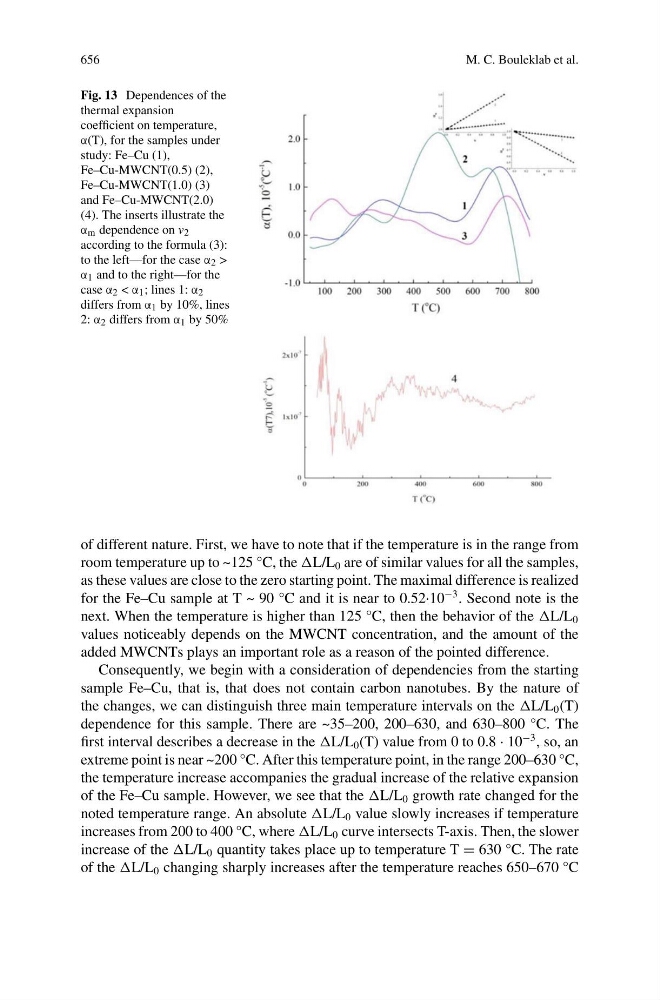
Fig. 13 Dependences of the
thermal expansion
coefficient on temperature,
α(T), for the samples under
study: Fe–Cu (1),
Fe–Cu-MWCNT(0.5) (2),
Fe–Cu-MWCNT(1.0) (3)
and Fe–Cu-MWCNT(2.0)
(4). The inserts illustrate the
α m dependence on v 2
according to the formula (3):
to the left—for the case α 2 >
α 1 and to the right—for the
case α 2 < α 1 ; lines 1: α 2
differs from α 1 by 10%, lines
2: α 2 differs from α 1 by 50%
of different nature. First, we have to note that if the temperature is in the range from
room temperature up to ~125 °C, the L/L 0 are of similar values for all the samples,
as these values are close to the zero starting point. The maximal difference is realized
for the Fe–Cu sample at T ~ 90 °C and it is near to 0.52·10
−3 . Second note is the
next. When the temperature is higher than 125 °C, then the behavior of the L/L 0
values noticeably depends on the MWCNT concentration, and the amount of the
added MWCNTs plays an important role as a reason of the pointed difference.
Consequently, we begin with a consideration of dependencies from the starting
sample Fe–Cu, that is, that does not contain carbon nanotubes. By the nature of
the changes, we can distinguish three main temperature intervals on the L/L 0 (T)
dependence for this sample. There are ~35–200, 200–630, and 630–800 °C. The
first interval describes a decrease in the L/L 0 (T) value from 0 to 0.8 · 10
−3 , so, an
extreme point is near ~200 °C. After this temperature point, in the range 200–630 °C,
the temperature increase accompanies the gradual increase of the relative expansion
of the Fe–Cu sample. However, we see that the L/L 0 growth rate changed for the
noted temperature range. An absolute L/L 0 value slowly increases if temperature
increases from 200 to 400 °C, where L/L 0 curve intersects T-axis. Then, the slower
increase of the L/L 0 quantity takes place up to temperature T = 630 °C. The rate
of the L/L 0 changing sharply increases after the temperature reaches 650–670 °C