

Influence of the Carbon Allotropes on Dilatometric Properties …
655
peaks interpolation by the Lorentz function. The average grain size formed after
mechanical alloying was estimated by the well-known Debye–Scherrer approach.
The TEM images of the CNTs and composites after milling were obtained using
transmission electron microscope SELMI PEM125 K operated at 100 kV. The IR
absorption and Raman (macro-Raman monitoring) spectra were measured using a
Jasco FT/130 IR-6300 (Jasco Analytical Instruments, Easton, MD, USA), Bruker
SENTERRA (Bruker, Billerica, MA, USA). The triple T64000 Horiba Jobin-Yvon
spectrometer equipped with quasi-confocal scanning microscope was used for the
micro-Raman scattering measurements. The scanning and optical systems allowed
the movement of the object at XYZ-coordinates with 100 nm accuracy and collection information about light scattering with submicron spatial resolution. The Ar–Kr
Spectra-Physics 2018 laser with a wavelength of the incident light, λ inc = 488 nm
was used for these measurements. Optical microscopy of the sample was performed
simultaneously with micro-Raman measurements.
4.2 Results and Discussion
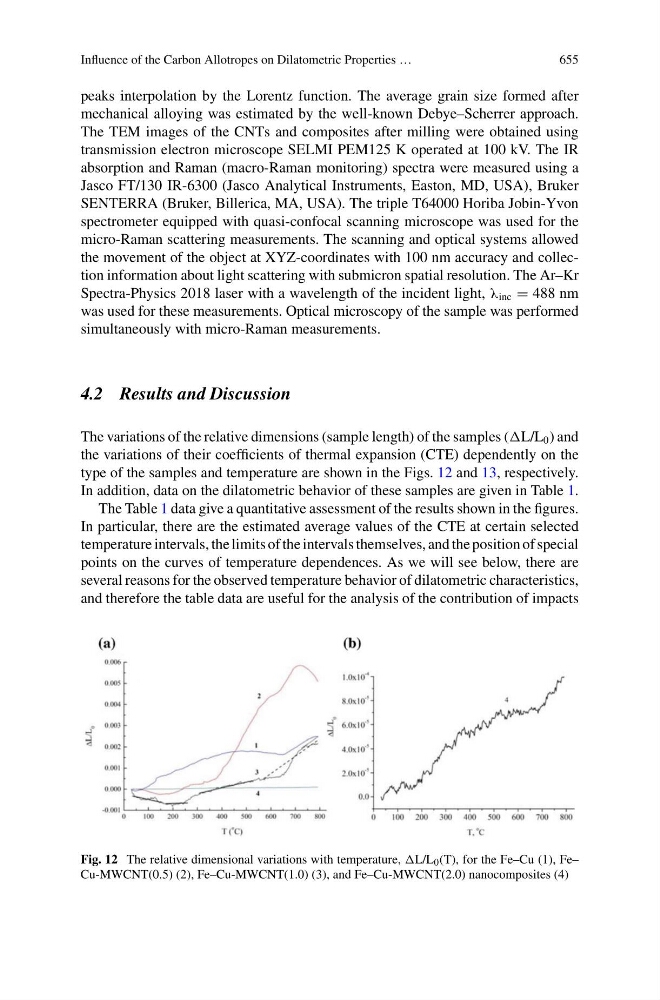
The variations of the relative dimensions (sample length) of the samples (L/L 0 ) and
the variations of their coefficients of thermal expansion (CTE) dependently on the
type of the samples and temperature are shown in the Figs. 12 and 13, respectively.
In addition, data on the dilatometric behavior of these samples are given in Table 1.
The Table 1 data give a quantitative assessment of the results shown in the figures.
In particular, there are the estimated average values of the CTE at certain selected
temperature intervals, the limits of the intervals themselves, and the position of special
points on the curves of temperature dependences. As we will see below, there are
several reasons for the observed temperature behavior of dilatometric characteristics,
and therefore the table data are useful for the analysis of the contribution of impacts
Fig. 12 The relative dimensional variations with temperature, L/L 0 (T), for the Fe–Cu (1), Fe–
Cu-MWCNT(0.5) (2), Fe–Cu-MWCNT(1.0) (3), and Fe–Cu-MWCNT(2.0) nanocomposites (4)