

Physical–Chemical Properties of Magnetite Nanoparticles Doped …
547
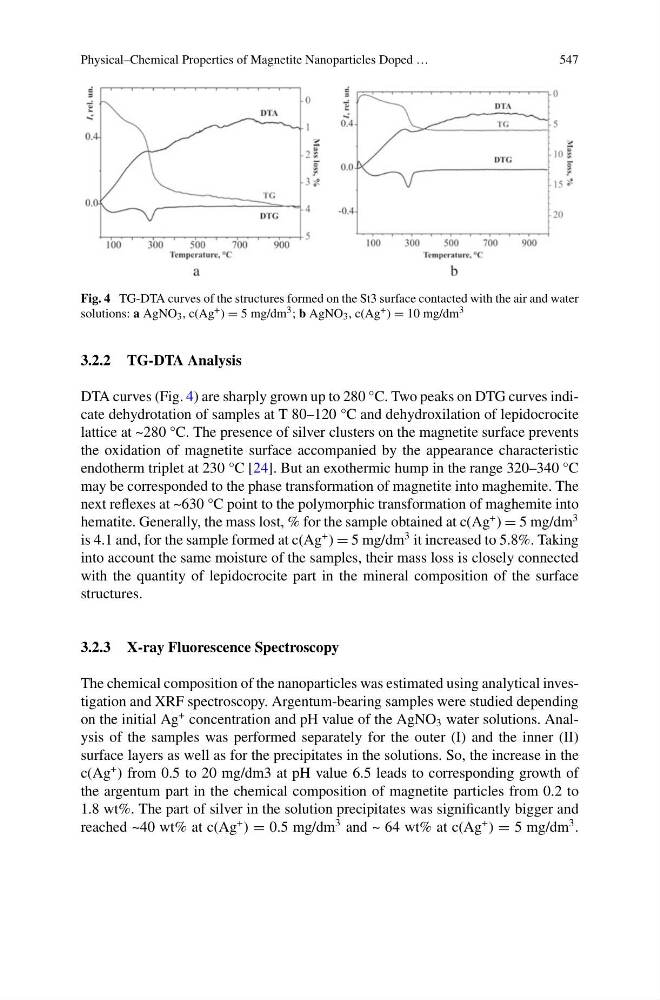
Fig. 4 TG-DTA curves of the structures formed on the St3 surface contacted with the air and water
solutions: a AgNO 3 , c(Ag + ) = 5 mg/dm 3 ; b AgNO 3 , c(Ag + ) = 10 mg/dm 3
3.2.2 TG-DTA Analysis
DTA curves (Fig. 4) are sharply grown up to 280 °C. Two peaks on DTG curves indicate dehydrotation of samples at T 80–120 °C and dehydroxilation of lepidocrocite
lattice at ~280 °C. The presence of silver clusters on the magnetite surface prevents
the oxidation of magnetite surface accompanied by the appearance characteristic
endotherm triplet at 230 °C [24]. But an exothermic hump in the range 320–340 °C
may be corresponded to the phase transformation of magnetite into maghemite. The
next reflexes at ~630 °C point to the polymorphic transformation of maghemite into
hematite. Generally, the mass lost, % for the sample obtained at c(Ag
+ ) = 5 mg/dm
3
is 4.1 and, for the sample formed at c(Ag
+ ) = 5 mg/dm
3 it increased to 5.8%. Taking
into account the same moisture of the samples, their mass loss is closely connected
with the quantity of lepidocrocite part in the mineral composition of the surface
structures.
3.2.3 X-ray Fluorescence Spectroscopy
The chemical composition of the nanoparticles was estimated using analytical investigation and XRF spectroscopy. Argentum-bearing samples were studied depending
on the initial Ag
+ concentration and pH value of the AgNO 3 water solutions. Analysis of the samples was performed separately for the outer (I) and the inner (II)
surface layers as well as for the precipitates in the solutions. So, the increase in the
c(Ag
+ ) from 0.5 to 20 mg/dm3 at pH value 6.5 leads to corresponding growth of
the argentum part in the chemical composition of magnetite particles from 0.2 to
1.8 wt%. The part of silver in the solution precipitates was significantly bigger and
reached ~40 wt% at c(Ag
+ ) = 0.5 mg/dm
3 and ~ 64 wt% at c(Ag
+ ) = 5 mg/dm
3 .
547
Fig. 4 TG-DTA curves of the structures formed on the St3 surface contacted with the air and water
solutions: a AgNO 3 , c(Ag + ) = 5 mg/dm 3 ; b AgNO 3 , c(Ag + ) = 10 mg/dm 3
3.2.2 TG-DTA Analysis
DTA curves (Fig. 4) are sharply grown up to 280 °C. Two peaks on DTG curves indicate dehydrotation of samples at T 80–120 °C and dehydroxilation of lepidocrocite
lattice at ~280 °C. The presence of silver clusters on the magnetite surface prevents
the oxidation of magnetite surface accompanied by the appearance characteristic
endotherm triplet at 230 °C [24]. But an exothermic hump in the range 320–340 °C
may be corresponded to the phase transformation of magnetite into maghemite. The
next reflexes at ~630 °C point to the polymorphic transformation of maghemite into
hematite. Generally, the mass lost, % for the sample obtained at c(Ag
+ ) = 5 mg/dm
3
is 4.1 and, for the sample formed at c(Ag
+ ) = 5 mg/dm
3 it increased to 5.8%. Taking
into account the same moisture of the samples, their mass loss is closely connected
with the quantity of lepidocrocite part in the mineral composition of the surface
structures.
3.2.3 X-ray Fluorescence Spectroscopy
The chemical composition of the nanoparticles was estimated using analytical investigation and XRF spectroscopy. Argentum-bearing samples were studied depending
on the initial Ag
+ concentration and pH value of the AgNO 3 water solutions. Analysis of the samples was performed separately for the outer (I) and the inner (II)
surface layers as well as for the precipitates in the solutions. So, the increase in the
c(Ag
+ ) from 0.5 to 20 mg/dm3 at pH value 6.5 leads to corresponding growth of
the argentum part in the chemical composition of magnetite particles from 0.2 to
1.8 wt%. The part of silver in the solution precipitates was significantly bigger and
reached ~40 wt% at c(Ag
+ ) = 0.5 mg/dm
3 and ~ 64 wt% at c(Ag
+ ) = 5 mg/dm
3 .