

494
L. V. Karabanova et al.
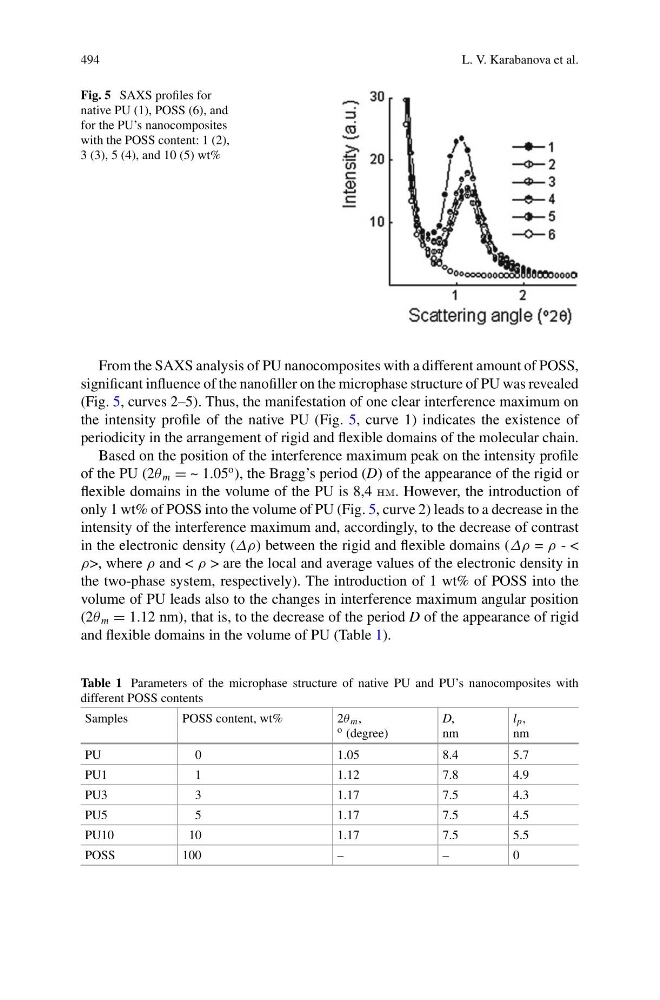
Fig. 5 SAXS profiles for
native PU (1), POSS (6), and
for the PU’s nanocomposites
with the POSS content: 1 (2),
3 (3), 5 (4), and 10 (5) wt%
From the SAXS analysis of PU nanocomposites with a different amount of POSS,
significant influence of the nanofiller on the microphase structure of PU was revealed
(Fig. 5, curves 2–5). Thus, the manifestation of one clear interference maximum on
the intensity profile of the native PU (Fig. 5, curve 1) indicates the existence of
periodicity in the arrangement of rigid and flexible domains of the molecular chain.
Based on the position of the interference maximum peak on the intensity profile
of the PU (2θ m = ~ 1.05
o ), the Bragg’s period (D) of the appearance of the rigid or
flexible domains in the volume of the PU is 8,4 nm. However, the introduction of
only 1 wt% of POSS into the volume of PU (Fig. 5, curve 2) leads to a decrease in the
intensity of the interference maximum and, accordingly, to the decrease of contrast
in the electronic density (Δρ) between the rigid and flexible domains (Δρ = ρ - <
ρ>, where ρ and < ρ > are the local and average values of the electronic density in
the two-phase system, respectively). The introduction of 1 wt% of POSS into the
volume of PU leads also to the changes in interference maximum angular position
(2θ m = 1.12 nm), that is, to the decrease of the period D of the appearance of rigid
and flexible domains in the volume of PU (Table 1).
Table 1 Parameters of the microphase structure of native PU and PU’s nanocomposites with
different POSS contents
Samples
POSS content, wt%
2θ m ,
o (degree)
D,
nm
l p ,
nm
PU
0
1.05
8.4
5.7
PU1
1
1.12
7.8
4.9
PU3
3
1.17
7.5
4.3
PU5
5
1.17
7.5
4.5
PU10
10
1.17
7.5
5.5
POSS
100
–
–
0
L. V. Karabanova et al.
Fig. 5 SAXS profiles for
native PU (1), POSS (6), and
for the PU’s nanocomposites
with the POSS content: 1 (2),
3 (3), 5 (4), and 10 (5) wt%
From the SAXS analysis of PU nanocomposites with a different amount of POSS,
significant influence of the nanofiller on the microphase structure of PU was revealed
(Fig. 5, curves 2–5). Thus, the manifestation of one clear interference maximum on
the intensity profile of the native PU (Fig. 5, curve 1) indicates the existence of
periodicity in the arrangement of rigid and flexible domains of the molecular chain.
Based on the position of the interference maximum peak on the intensity profile
of the PU (2θ m = ~ 1.05
o ), the Bragg’s period (D) of the appearance of the rigid or
flexible domains in the volume of the PU is 8,4 nm. However, the introduction of
only 1 wt% of POSS into the volume of PU (Fig. 5, curve 2) leads to a decrease in the
intensity of the interference maximum and, accordingly, to the decrease of contrast
in the electronic density (Δρ) between the rigid and flexible domains (Δρ = ρ - <
ρ>, where ρ and < ρ > are the local and average values of the electronic density in
the two-phase system, respectively). The introduction of 1 wt% of POSS into the
volume of PU leads also to the changes in interference maximum angular position
(2θ m = 1.12 nm), that is, to the decrease of the period D of the appearance of rigid
and flexible domains in the volume of PU (Table 1).
Table 1 Parameters of the microphase structure of native PU and PU’s nanocomposites with
different POSS contents
Samples
POSS content, wt%
2θ m ,
o (degree)
D,
nm
l p ,
nm
PU
0
1.05
8.4
5.7
PU1
1
1.12
7.8
4.9
PU3
3
1.17
7.5
4.3
PU5
5
1.17
7.5
4.5
PU10
10
1.17
7.5
5.5
POSS
100
–
–
0