

Structure and Properties of the POSS-Containing Nanocomposites …
491
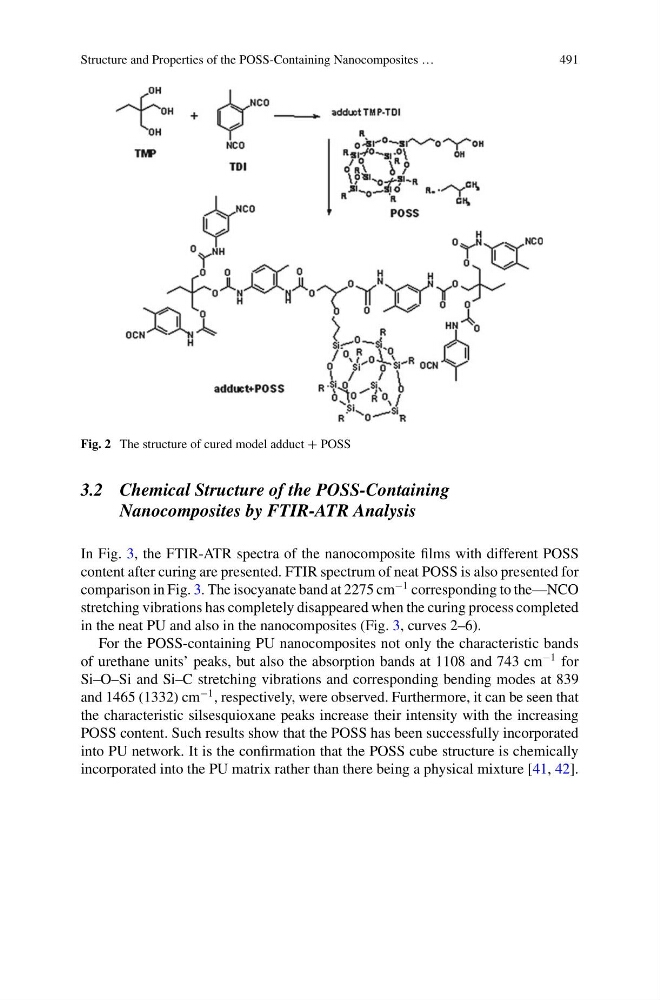
Fig. 2 The structure of cured model adduct + POSS
3.2 Chemical Structure of the POSS-Containing
Nanocomposites by FTIR-ATR Analysis
In Fig. 3, the FTIR-ATR spectra of the nanocomposite films with different POSS
content after curing are presented. FTIR spectrum of neat POSS is also presented for
comparison in Fig. 3. The isocyanate band at 2275 cm
−1 corresponding to the—NCO
stretching vibrations has completely disappeared when the curing process completed
in the neat PU and also in the nanocomposites (Fig. 3, curves 2–6).
For the POSS-containing PU nanocomposites not only the characteristic bands
of urethane units’ peaks, but also the absorption bands at 1108 and 743 cm
−1 for
Si–O–Si and Si–C stretching vibrations and corresponding bending modes at 839
and 1465 (1332) cm
−1 , respectively, were observed. Furthermore, it can be seen that
the characteristic silsesquioxane peaks increase their intensity with the increasing
POSS content. Such results show that the POSS has been successfully incorporated
into PU network. It is the confirmation that the POSS cube structure is chemically
incorporated into the PU matrix rather than there being a physical mixture [41, 42].
491
Fig. 2 The structure of cured model adduct + POSS
3.2 Chemical Structure of the POSS-Containing
Nanocomposites by FTIR-ATR Analysis
In Fig. 3, the FTIR-ATR spectra of the nanocomposite films with different POSS
content after curing are presented. FTIR spectrum of neat POSS is also presented for
comparison in Fig. 3. The isocyanate band at 2275 cm
−1 corresponding to the—NCO
stretching vibrations has completely disappeared when the curing process completed
in the neat PU and also in the nanocomposites (Fig. 3, curves 2–6).
For the POSS-containing PU nanocomposites not only the characteristic bands
of urethane units’ peaks, but also the absorption bands at 1108 and 743 cm
−1 for
Si–O–Si and Si–C stretching vibrations and corresponding bending modes at 839
and 1465 (1332) cm
−1 , respectively, were observed. Furthermore, it can be seen that
the characteristic silsesquioxane peaks increase their intensity with the increasing
POSS content. Such results show that the POSS has been successfully incorporated
into PU network. It is the confirmation that the POSS cube structure is chemically
incorporated into the PU matrix rather than there being a physical mixture [41, 42].