

Epoxy Molecular Structure Alteration in Graphene …
473
However, TDCs for water (see Fig. 7b) reveal two bounded state for water molecules
inside the epoxy and its nanocomposites. It is remarkable that the water-related LT
peak proved to be partially suppressed with increases the loading. Thus, loosely
bounded water molecules can be considered as the relaxators contributing into the
MDR-relaxation.
Also, different from the others, the behavior is demonstrated by the nitrogencontaining moiety of m/z = 31 (methylamine), which terminates polyamine’s
molecules of the PEPA-hardener. Its LT peak increases with increasing the loadings.
This fact provides the direct evidence for breaking the cross-links in the epoxy.
Also, it’s clear seen from Fig. 7 that different moieties show non-monotonous
loading dependences of maximal value I max of the intensity, namely: I max decreases
at C f ≤ 1%, then increases at 1% < C f ≤ 2%, and then shows a weak decreasing
at 2% < C f ≤ 5%. It’s remarkable that I max (5%) ≈ I max (1%). On the whole, the
effect of lowering I max is a result of binding the moieties to ASSs of MLGNPs.
From the other hand, non-monotonous behavior of I max
C f
means a similar
non-monotonous behavior for outputs of the correspondent moieties. The amount or
output Q n
C f , T 1
of the n-th moiety emanated from a sample under heating it has
been determined from the obvious expression
Q n
C f , T 1
= A 0
T 1
T 0
I n
C f , τ
dτ
(7)
where A 0 is a dimension parameter, I n
C f , τ
is the temperature dependence of the
thermal desorption intensity of the n-th m/z-moiety, T 0 and T 1 are the temperature
limits for integration.
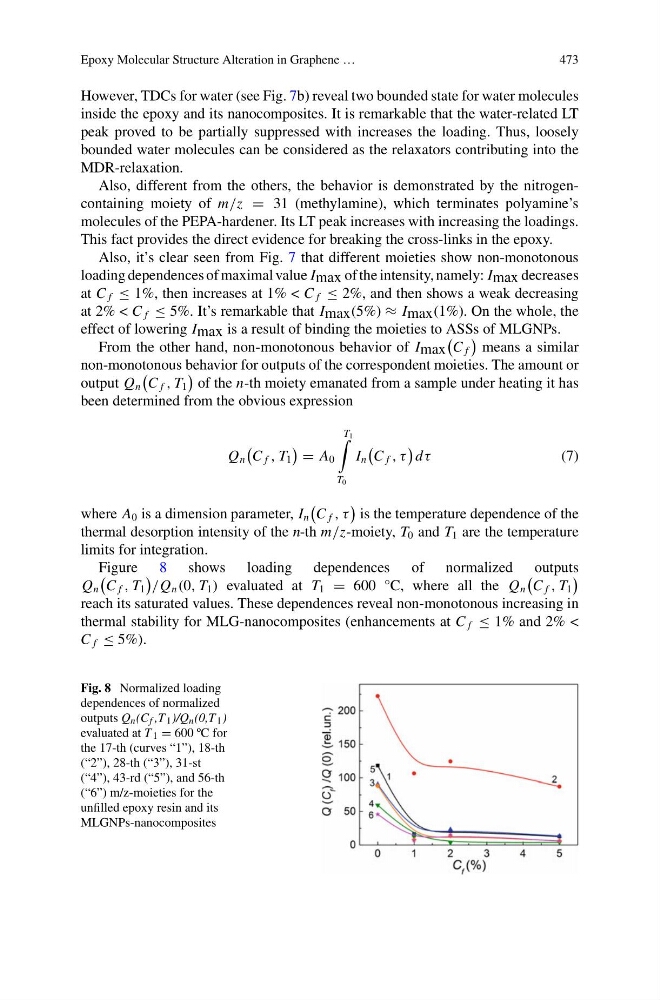
Figure 8 shows loading dependences of normalized outputs
Q n
C f , T 1
/Q n (0, T 1 ) evaluated at T 1 = 600 °C, where all the Q n
C f , T 1
reach its saturated values. These dependences reveal non-monotonous increasing in
thermal stability for MLG-nanocomposites (enhancements at C f ≤ 1% and 2% <
C f ≤ 5%).
Fig. 8 Normalized loading
dependences of normalized
outputs Q n (C f ,T 1 )/Q n (0,T 1 )
evaluated at T 1 = 600 ºC for
the 17-th (curves “1”), 18-th
(“2”), 28-th (“3”), 31-st
(“4”), 43-rd (“5”), and 56-th
(“6”) m/z-moieties for the
unfilled epoxy resin and its
MLGNPs-nanocomposites
473
However, TDCs for water (see Fig. 7b) reveal two bounded state for water molecules
inside the epoxy and its nanocomposites. It is remarkable that the water-related LT
peak proved to be partially suppressed with increases the loading. Thus, loosely
bounded water molecules can be considered as the relaxators contributing into the
MDR-relaxation.
Also, different from the others, the behavior is demonstrated by the nitrogencontaining moiety of m/z = 31 (methylamine), which terminates polyamine’s
molecules of the PEPA-hardener. Its LT peak increases with increasing the loadings.
This fact provides the direct evidence for breaking the cross-links in the epoxy.
Also, it’s clear seen from Fig. 7 that different moieties show non-monotonous
loading dependences of maximal value I max of the intensity, namely: I max decreases
at C f ≤ 1%, then increases at 1% < C f ≤ 2%, and then shows a weak decreasing
at 2% < C f ≤ 5%. It’s remarkable that I max (5%) ≈ I max (1%). On the whole, the
effect of lowering I max is a result of binding the moieties to ASSs of MLGNPs.
From the other hand, non-monotonous behavior of I max
C f
means a similar
non-monotonous behavior for outputs of the correspondent moieties. The amount or
output Q n
C f , T 1
of the n-th moiety emanated from a sample under heating it has
been determined from the obvious expression
Q n
C f , T 1
= A 0
T 1
T 0
I n
C f , τ
dτ
(7)
where A 0 is a dimension parameter, I n
C f , τ
is the temperature dependence of the
thermal desorption intensity of the n-th m/z-moiety, T 0 and T 1 are the temperature
limits for integration.
Figure 8 shows loading dependences of normalized outputs
Q n
C f , T 1
/Q n (0, T 1 ) evaluated at T 1 = 600 °C, where all the Q n
C f , T 1
reach its saturated values. These dependences reveal non-monotonous increasing in
thermal stability for MLG-nanocomposites (enhancements at C f ≤ 1% and 2% <
C f ≤ 5%).
Fig. 8 Normalized loading
dependences of normalized
outputs Q n (C f ,T 1 )/Q n (0,T 1 )
evaluated at T 1 = 600 ºC for
the 17-th (curves “1”), 18-th
(“2”), 28-th (“3”), 31-st
(“4”), 43-rd (“5”), and 56-th
(“6”) m/z-moieties for the
unfilled epoxy resin and its
MLGNPs-nanocomposites