

Features of Phase Formation Processes in Amorphous Alloys …
419
0
1
2
3
4
5
6
7
8
9
1 0
-582
-580
-578
-576
-574
-572
-570
-568
-566
V
300 K
450 K
600 K
E
E, Ha
N step
heating
T= 1600K
annealing at T
"crystalline"
supercell Fe 29 Zr 3
2550
2600
2650
2700
2750
2800
V
V,
bohr
3
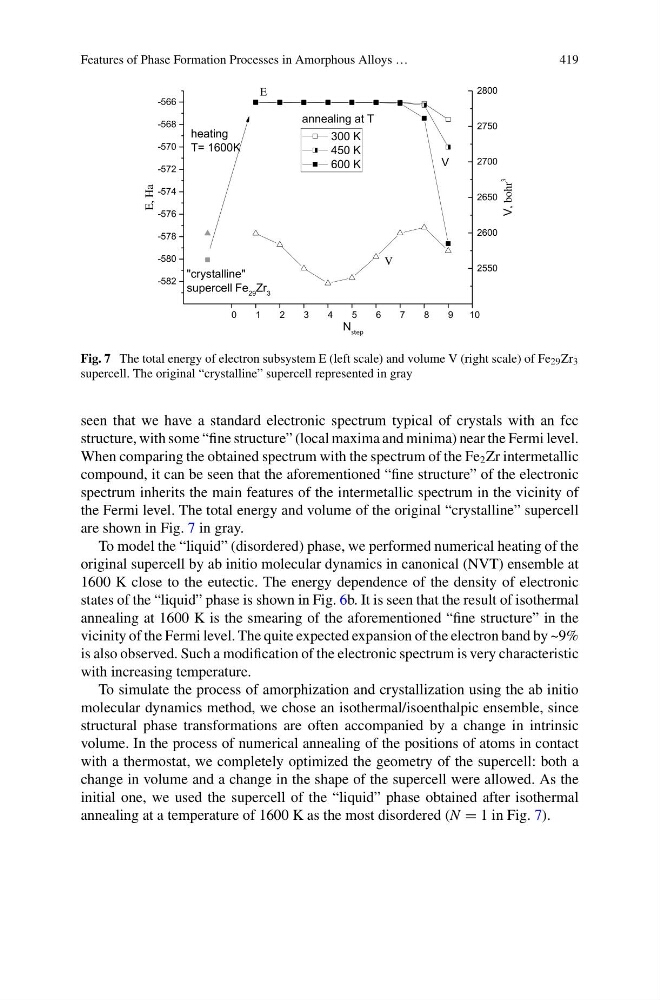
Fig. 7 The total energy of electron subsystem E (left scale) and volume V (right scale) of Fe 29 Zr 3
supercell. The original “crystalline” supercell represented in gray
seen that we have a standard electronic spectrum typical of crystals with an fcc
structure, with some “fine structure” (local maxima and minima) near the Fermi level.
When comparing the obtained spectrum with the spectrum of the Fe 2 Zr intermetallic
compound, it can be seen that the aforementioned “fine structure” of the electronic
spectrum inherits the main features of the intermetallic spectrum in the vicinity of
the Fermi level. The total energy and volume of the original “crystalline” supercell
are shown in Fig. 7 in gray.
To model the “liquid” (disordered) phase, we performed numerical heating of the
original supercell by ab initio molecular dynamics in canonical (NVT) ensemble at
1600 K close to the eutectic. The energy dependence of the density of electronic
states of the “liquid” phase is shown in Fig. 6b. It is seen that the result of isothermal
annealing at 1600 K is the smearing of the aforementioned “fine structure” in the
vicinity of the Fermi level. The quite expected expansion of the electron band by ~9%
is also observed. Such a modification of the electronic spectrum is very characteristic
with increasing temperature.
To simulate the process of amorphization and crystallization using the ab initio
molecular dynamics method, we chose an isothermal/isoenthalpic ensemble, since
structural phase transformations are often accompanied by a change in intrinsic
volume. In the process of numerical annealing of the positions of atoms in contact
with a thermostat, we completely optimized the geometry of the supercell: both a
change in volume and a change in the shape of the supercell were allowed. As the
initial one, we used the supercell of the “liquid” phase obtained after isothermal
annealing at a temperature of 1600 K as the most disordered (N = 1 in Fig. 7).
419
0
1
2
3
4
5
6
7
8
9
1 0
-582
-580
-578
-576
-574
-572
-570
-568
-566
V
300 K
450 K
600 K
E
E, Ha
N step
heating
T= 1600K
annealing at T
"crystalline"
supercell Fe 29 Zr 3
2550
2600
2650
2700
2750
2800
V
V,
bohr
3
Fig. 7 The total energy of electron subsystem E (left scale) and volume V (right scale) of Fe 29 Zr 3
supercell. The original “crystalline” supercell represented in gray
seen that we have a standard electronic spectrum typical of crystals with an fcc
structure, with some “fine structure” (local maxima and minima) near the Fermi level.
When comparing the obtained spectrum with the spectrum of the Fe 2 Zr intermetallic
compound, it can be seen that the aforementioned “fine structure” of the electronic
spectrum inherits the main features of the intermetallic spectrum in the vicinity of
the Fermi level. The total energy and volume of the original “crystalline” supercell
are shown in Fig. 7 in gray.
To model the “liquid” (disordered) phase, we performed numerical heating of the
original supercell by ab initio molecular dynamics in canonical (NVT) ensemble at
1600 K close to the eutectic. The energy dependence of the density of electronic
states of the “liquid” phase is shown in Fig. 6b. It is seen that the result of isothermal
annealing at 1600 K is the smearing of the aforementioned “fine structure” in the
vicinity of the Fermi level. The quite expected expansion of the electron band by ~9%
is also observed. Such a modification of the electronic spectrum is very characteristic
with increasing temperature.
To simulate the process of amorphization and crystallization using the ab initio
molecular dynamics method, we chose an isothermal/isoenthalpic ensemble, since
structural phase transformations are often accompanied by a change in intrinsic
volume. In the process of numerical annealing of the positions of atoms in contact
with a thermostat, we completely optimized the geometry of the supercell: both a
change in volume and a change in the shape of the supercell were allowed. As the
initial one, we used the supercell of the “liquid” phase obtained after isothermal
annealing at a temperature of 1600 K as the most disordered (N = 1 in Fig. 7).