

The Influence of La Doping on Structural, Optical …
373
In the case of 2La/TiO 2 , the intensity of the XPS spectrum of La 3d increases in
comparison with 1La/TiO 2 . In the sequence 1La/TiO 2 → 2La/TiO 2 , the half-width
of the main XPS valence band spectrum decreases by about 0.3 eV (Fig. 8d).
Some changes of the binding energy of the La 3d 5/2 core-level spectrum (Table 4)
can be explained by superposition of this spectrum with the Ti L 3 M 23 M 45 Auger line
in such a case (Fig. 8c). In the investigated samples, the Ti 3p core-level spectrum
superimposes the La 5s spectrum, while superposition of the O 2s and La 5p spectra
is also observed (Fig. 8d).
Two peaks of C1s spectra with binding energy values located at ~290.0 and
284.85 eV, correspond to C–O and C–C bonds, respectively [5]. These data testify
that no additional admixtures except for adsorbed hydrocarbons are detected.
3.6 DRUV Spectra Determination of the Catalyst Band Gap
The diffuse reflection spectra in the coordinates F(R) = f (λ, nm), where F(R) is the
Kubelka–Munch function, were recorded. All the materials were grounded directly
in an agate mortar before recording the DRUV spectra and obtaining constant optical
characteristics.
The fundamental band gap E g is an important characteristic of semiconductors. It
is attributed to the inter-band transitions of electrons between the highest occupied
2p states of O in the valence band and the lowest unoccupied 3d states of Ti in the
conduction band. The electron transitions in the bandgap of TiO 2 can be attributed to
the direct or indirect transitions depending on the crystal structure, material dispersion, etc. [42]. These two different types of transitions can be distinguished by the
energy dependence of the corresponding absorption edge. The value of E g was estimated using the method proposed by Wood and Tauc by extrapolation of the linear
part of the plot (hν * α(hν))
1/n versus hν toward energy axis at α(hν) = 0 (n = ½ for
direct allowed transitions, n = 2 for indirect allowed transitions). We determined E g
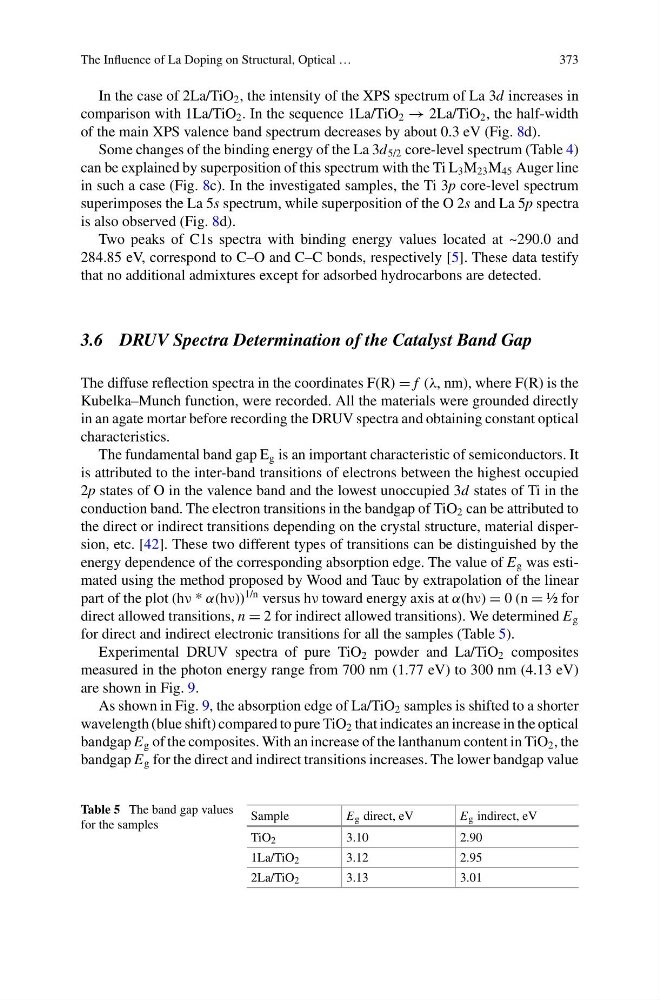
for direct and indirect electronic transitions for all the samples (Table 5).
Experimental DRUV spectra of pure TiO 2 powder and La/TiO 2 composites
measured in the photon energy range from 700 nm (1.77 eV) to 300 nm (4.13 eV)
are shown in Fig. 9.
As shown in Fig. 9, the absorption edge of La/TiO 2 samples is shifted to a shorter
wavelength (blue shift) compared to pure TiO 2 that indicates an increase in the optical
bandgap E g of the composites. With an increase of the lanthanum content in TiO 2 , the
bandgap E g for the direct and indirect transitions increases. The lower bandgap value
Table 5 The band gap values
for the samples
Sample
E g direct, eV
E g indirect, eV
TiO 2
3.10
2.90
1La/TiO 2
3.12
2.95
2La/TiO 2
3.13
3.01
373
In the case of 2La/TiO 2 , the intensity of the XPS spectrum of La 3d increases in
comparison with 1La/TiO 2 . In the sequence 1La/TiO 2 → 2La/TiO 2 , the half-width
of the main XPS valence band spectrum decreases by about 0.3 eV (Fig. 8d).
Some changes of the binding energy of the La 3d 5/2 core-level spectrum (Table 4)
can be explained by superposition of this spectrum with the Ti L 3 M 23 M 45 Auger line
in such a case (Fig. 8c). In the investigated samples, the Ti 3p core-level spectrum
superimposes the La 5s spectrum, while superposition of the O 2s and La 5p spectra
is also observed (Fig. 8d).
Two peaks of C1s spectra with binding energy values located at ~290.0 and
284.85 eV, correspond to C–O and C–C bonds, respectively [5]. These data testify
that no additional admixtures except for adsorbed hydrocarbons are detected.
3.6 DRUV Spectra Determination of the Catalyst Band Gap
The diffuse reflection spectra in the coordinates F(R) = f (λ, nm), where F(R) is the
Kubelka–Munch function, were recorded. All the materials were grounded directly
in an agate mortar before recording the DRUV spectra and obtaining constant optical
characteristics.
The fundamental band gap E g is an important characteristic of semiconductors. It
is attributed to the inter-band transitions of electrons between the highest occupied
2p states of O in the valence band and the lowest unoccupied 3d states of Ti in the
conduction band. The electron transitions in the bandgap of TiO 2 can be attributed to
the direct or indirect transitions depending on the crystal structure, material dispersion, etc. [42]. These two different types of transitions can be distinguished by the
energy dependence of the corresponding absorption edge. The value of E g was estimated using the method proposed by Wood and Tauc by extrapolation of the linear
part of the plot (hν * α(hν))
1/n versus hν toward energy axis at α(hν) = 0 (n = ½ for
direct allowed transitions, n = 2 for indirect allowed transitions). We determined E g
for direct and indirect electronic transitions for all the samples (Table 5).
Experimental DRUV spectra of pure TiO 2 powder and La/TiO 2 composites
measured in the photon energy range from 700 nm (1.77 eV) to 300 nm (4.13 eV)
are shown in Fig. 9.
As shown in Fig. 9, the absorption edge of La/TiO 2 samples is shifted to a shorter
wavelength (blue shift) compared to pure TiO 2 that indicates an increase in the optical
bandgap E g of the composites. With an increase of the lanthanum content in TiO 2 , the
bandgap E g for the direct and indirect transitions increases. The lower bandgap value
Table 5 The band gap values
for the samples
Sample
E g direct, eV
E g indirect, eV
TiO 2
3.10
2.90
1La/TiO 2
3.12
2.95
2La/TiO 2
3.13
3.01