

368
T. A. Khalyavka et al.
Table 2 Phase composition and structural characteristics of the samples
Sample
Phase
composition,
hkl
Phase
content,
%
Interplanar spacing,
d, nm
Lattice
parameters,
Å
Crystallite
size, D hkl ,
nm
Volume
molecular
unit TiO 2
V = a 2 c,
Å 3
Axial
ratio,
c/a
TiO 2
A
(101)
87.2
0.348
a = 3.7774
c = 9.2034
10
131.32
2.44
R
(110)
12.8
0.322
a = 4.5740
c = 2.9577
7
61.88
0.65
1La/TiO 2 A (101)
66.7
0.349
a = 3.7616
c = 9.4853
8
134.21
2.52
R (110)
20.9
0.324
–
6
–
–
La x Ti y O z
12.4
–
–
–
–
–
2La/TiO 2 A (101)
46.8
0.351
a = 3.8135
c =
12.5968
8
183.19
3.30
R (110)
26.4
0.317
–
5
–
–
La x Ti y O z
26.8
–
–
–
–
–
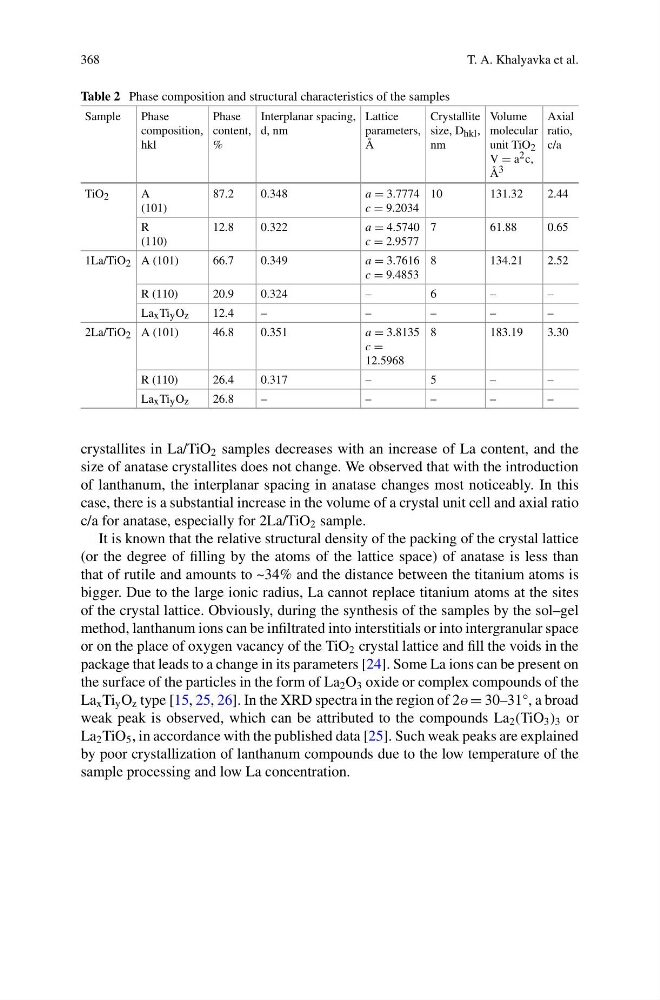
crystallites in La/TiO 2 samples decreases with an increase of La content, and the
size of anatase crystallites does not change. We observed that with the introduction
of lanthanum, the interplanar spacing in anatase changes most noticeably. In this
case, there is a substantial increase in the volume of a crystal unit cell and axial ratio
c/a for anatase, especially for 2La/TiO 2 sample.
It is known that the relative structural density of the packing of the crystal lattice
(or the degree of filling by the atoms of the lattice space) of anatase is less than
that of rutile and amounts to ~34% and the distance between the titanium atoms is
bigger. Due to the large ionic radius, La cannot replace titanium atoms at the sites
of the crystal lattice. Obviously, during the synthesis of the samples by the sol–gel
method, lanthanum ions can be infiltrated into interstitials or into intergranular space
or on the place of oxygen vacancy of the TiO 2 crystal lattice and fill the voids in the
package that leads to a change in its parameters [24]. Some La ions can be present on
the surface of the particles in the form of La 2 O 3 oxide or complex compounds of the
La x Ti y O z type [15, 25, 26]. In the XRD spectra in the region of 28 = 30–31°, a broad
weak peak is observed, which can be attributed to the compounds La 2 (TiO 3 ) 3 or
La 2 TiO 5 , in accordance with the published data [25]. Such weak peaks are explained
by poor crystallization of lanthanum compounds due to the low temperature of the
sample processing and low La concentration.
T. A. Khalyavka et al.
Table 2 Phase composition and structural characteristics of the samples
Sample
Phase
composition,
hkl
Phase
content,
%
Interplanar spacing,
d, nm
Lattice
parameters,
Å
Crystallite
size, D hkl ,
nm
Volume
molecular
unit TiO 2
V = a 2 c,
Å 3
Axial
ratio,
c/a
TiO 2
A
(101)
87.2
0.348
a = 3.7774
c = 9.2034
10
131.32
2.44
R
(110)
12.8
0.322
a = 4.5740
c = 2.9577
7
61.88
0.65
1La/TiO 2 A (101)
66.7
0.349
a = 3.7616
c = 9.4853
8
134.21
2.52
R (110)
20.9
0.324
–
6
–
–
La x Ti y O z
12.4
–
–
–
–
–
2La/TiO 2 A (101)
46.8
0.351
a = 3.8135
c =
12.5968
8
183.19
3.30
R (110)
26.4
0.317
–
5
–
–
La x Ti y O z
26.8
–
–
–
–
–
crystallites in La/TiO 2 samples decreases with an increase of La content, and the
size of anatase crystallites does not change. We observed that with the introduction
of lanthanum, the interplanar spacing in anatase changes most noticeably. In this
case, there is a substantial increase in the volume of a crystal unit cell and axial ratio
c/a for anatase, especially for 2La/TiO 2 sample.
It is known that the relative structural density of the packing of the crystal lattice
(or the degree of filling by the atoms of the lattice space) of anatase is less than
that of rutile and amounts to ~34% and the distance between the titanium atoms is
bigger. Due to the large ionic radius, La cannot replace titanium atoms at the sites
of the crystal lattice. Obviously, during the synthesis of the samples by the sol–gel
method, lanthanum ions can be infiltrated into interstitials or into intergranular space
or on the place of oxygen vacancy of the TiO 2 crystal lattice and fill the voids in the
package that leads to a change in its parameters [24]. Some La ions can be present on
the surface of the particles in the form of La 2 O 3 oxide or complex compounds of the
La x Ti y O z type [15, 25, 26]. In the XRD spectra in the region of 28 = 30–31°, a broad
weak peak is observed, which can be attributed to the compounds La 2 (TiO 3 ) 3 or
La 2 TiO 5 , in accordance with the published data [25]. Such weak peaks are explained
by poor crystallization of lanthanum compounds due to the low temperature of the
sample processing and low La concentration.