

Formation of Manganese-Containing PEO Coatings on Aluminum Alloys
345
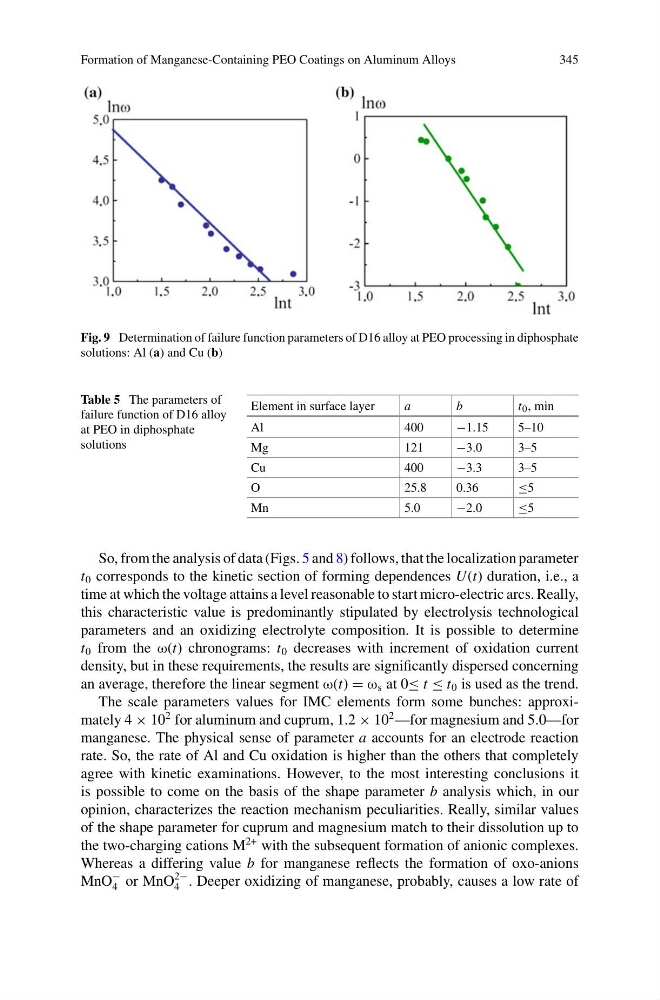
Fig. 9 Determination of failure function parameters of D16 alloy at PEO processing in diphosphate
solutions: Al (a) and Cu (b)
Table 5 The parameters of
failure function of D16 alloy
at PEO in diphosphate
solutions
Element in surface layer
a
b
t 0 , min
Al
400
−1.15
5–10
Mg
121
−3.0
3–5
Cu
400
−3.3
3–5
O
25.8
0.36
≤5
Mn
5.0
−2.0
≤5
So, from the analysis of data (Figs. 5 and 8) follows, that the localization parameter
t 0 corresponds to the kinetic section of forming dependences U(t) duration, i.e., a
time at which the voltage attains a level reasonable to start micro-electric arcs. Really,
this characteristic value is predominantly stipulated by electrolysis technological
parameters and an oxidizing electrolyte composition. It is possible to determine
t 0 from the ω(t) chronograms: t 0 decreases with increment of oxidation current
density, but in these requirements, the results are significantly dispersed concerning
an average, therefore the linear segment ω(t) = ω s at 0≤ t ≤ t 0 is used as the trend.
The scale parameters values for IMC elements form some bunches: approximately 4 × 10
2 for aluminum and cuprum, 1.2 × 10
2 —for magnesium and 5.0—for
manganese. The physical sense of parameter a accounts for an electrode reaction
rate. So, the rate of Al and Cu oxidation is higher than the others that completely
agree with kinetic examinations. However, to the most interesting conclusions it
is possible to come on the basis of the shape parameter b analysis which, in our
opinion, characterizes the reaction mechanism peculiarities. Really, similar values
of the shape parameter for cuprum and magnesium match to their dissolution up to
the two-charging cations M
2+ with the subsequent formation of anionic complexes.
Whereas a differing value b for manganese reflects the formation of oxo-anions
MnO
−
4 or MnO
2−
4 . Deeper oxidizing of manganese, probably, causes a low rate of
345
Fig. 9 Determination of failure function parameters of D16 alloy at PEO processing in diphosphate
solutions: Al (a) and Cu (b)
Table 5 The parameters of
failure function of D16 alloy
at PEO in diphosphate
solutions
Element in surface layer
a
b
t 0 , min
Al
400
−1.15
5–10
Mg
121
−3.0
3–5
Cu
400
−3.3
3–5
O
25.8
0.36
≤5
Mn
5.0
−2.0
≤5
So, from the analysis of data (Figs. 5 and 8) follows, that the localization parameter
t 0 corresponds to the kinetic section of forming dependences U(t) duration, i.e., a
time at which the voltage attains a level reasonable to start micro-electric arcs. Really,
this characteristic value is predominantly stipulated by electrolysis technological
parameters and an oxidizing electrolyte composition. It is possible to determine
t 0 from the ω(t) chronograms: t 0 decreases with increment of oxidation current
density, but in these requirements, the results are significantly dispersed concerning
an average, therefore the linear segment ω(t) = ω s at 0≤ t ≤ t 0 is used as the trend.
The scale parameters values for IMC elements form some bunches: approximately 4 × 10
2 for aluminum and cuprum, 1.2 × 10
2 —for magnesium and 5.0—for
manganese. The physical sense of parameter a accounts for an electrode reaction
rate. So, the rate of Al and Cu oxidation is higher than the others that completely
agree with kinetic examinations. However, to the most interesting conclusions it
is possible to come on the basis of the shape parameter b analysis which, in our
opinion, characterizes the reaction mechanism peculiarities. Really, similar values
of the shape parameter for cuprum and magnesium match to their dissolution up to
the two-charging cations M
2+ with the subsequent formation of anionic complexes.
Whereas a differing value b for manganese reflects the formation of oxo-anions
MnO
−
4 or MnO
2−
4 . Deeper oxidizing of manganese, probably, causes a low rate of