

268
L. Yu. Matzui et al.
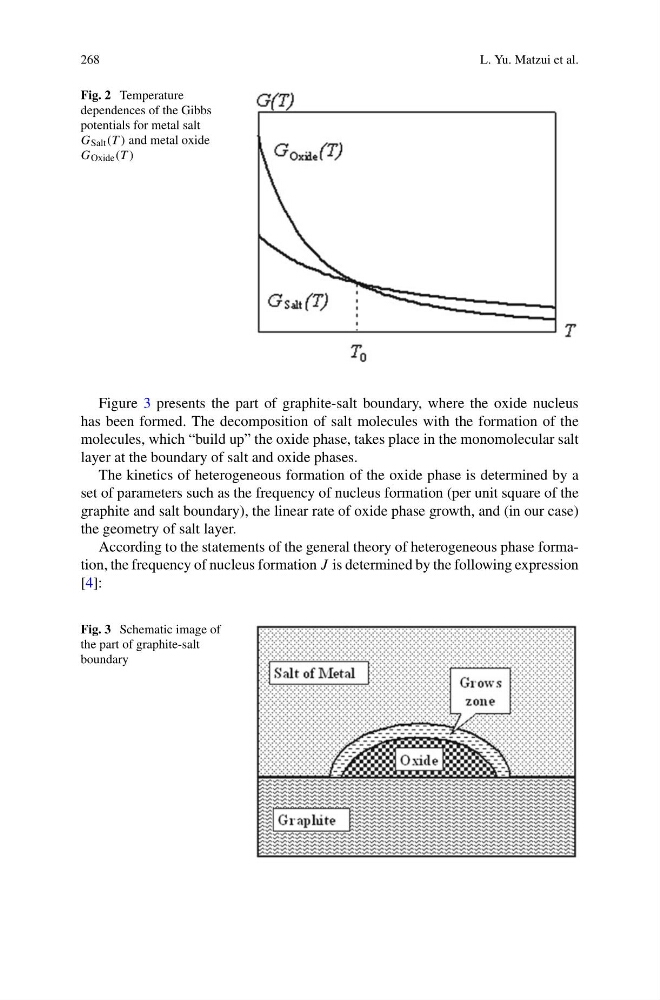
Fig. 2 Temperature
dependences of the Gibbs
potentials for metal salt
G Salt (T ) and metal oxide
G Oxide (T )
Figure 3 presents the part of graphite-salt boundary, where the oxide nucleus
has been formed. The decomposition of salt molecules with the formation of the
molecules, which “build up” the oxide phase, takes place in the monomolecular salt
layer at the boundary of salt and oxide phases.
The kinetics of heterogeneous formation of the oxide phase is determined by a
set of parameters such as the frequency of nucleus formation (per unit square of the
graphite and salt boundary), the linear rate of oxide phase growth, and (in our case)
the geometry of salt layer.
According to the statements of the general theory of heterogeneous phase formation, the frequency of nucleus formation J is determined by the following expression
[4]:
Fig. 3 Schematic image of
the part of graphite-salt
boundary
L. Yu. Matzui et al.
Fig. 2 Temperature
dependences of the Gibbs
potentials for metal salt
G Salt (T ) and metal oxide
G Oxide (T )
Figure 3 presents the part of graphite-salt boundary, where the oxide nucleus
has been formed. The decomposition of salt molecules with the formation of the
molecules, which “build up” the oxide phase, takes place in the monomolecular salt
layer at the boundary of salt and oxide phases.
The kinetics of heterogeneous formation of the oxide phase is determined by a
set of parameters such as the frequency of nucleus formation (per unit square of the
graphite and salt boundary), the linear rate of oxide phase growth, and (in our case)
the geometry of salt layer.
According to the statements of the general theory of heterogeneous phase formation, the frequency of nucleus formation J is determined by the following expression
[4]:
Fig. 3 Schematic image of
the part of graphite-salt
boundary