

222
Y. Kharchenko et al.
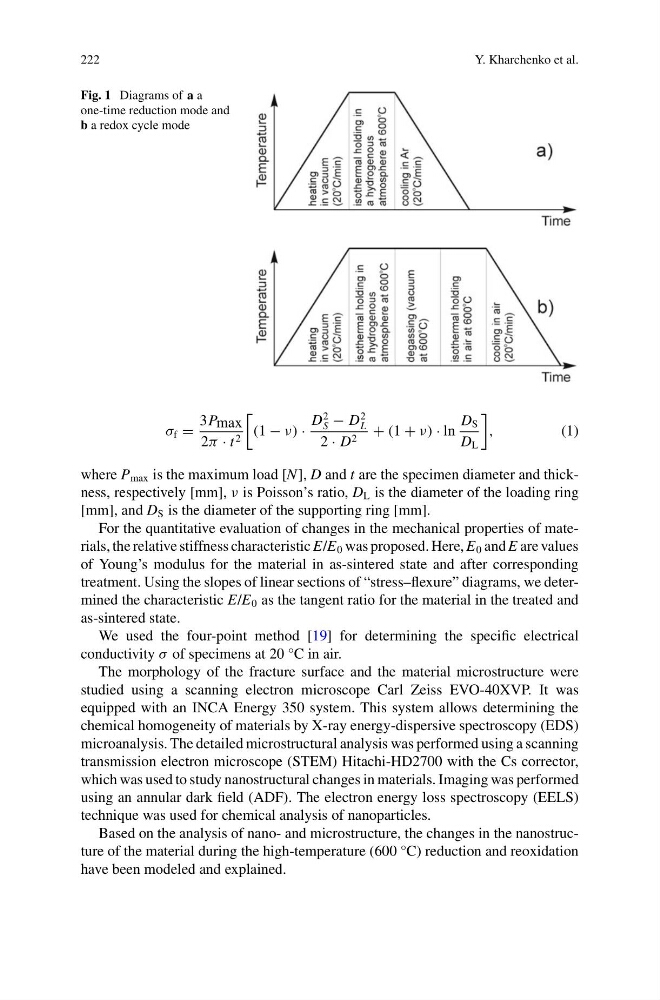
Fig. 1 Diagrams of a a
one-time reduction mode and
b a redox cycle mode
σ f =
3P max
2π · t 2
(1 − ν) ·
D
2
S − D
2
L
2 · D 2 + (1 + ν) · ln
D S
D L
,
(1)
where P max is the maximum load [N], D and t are the specimen diameter and thickness, respectively [mm], ν is Poisson’s ratio, D L is the diameter of the loading ring
[mm], and D S is the diameter of the supporting ring [mm].
For the quantitative evaluation of changes in the mechanical properties of materials, the relative stiffness characteristic E/E 0 was proposed. Here, E 0 and E are values
of Young’s modulus for the material in as-sintered state and after corresponding
treatment. Using the slopes of linear sections of “stress–flexure” diagrams, we determined the characteristic E/E 0 as the tangent ratio for the material in the treated and
as-sintered state.
We used the four-point method [19] for determining the specific electrical
conductivity σ of specimens at 20 °C in air.
The morphology of the fracture surface and the material microstructure were
studied using a scanning electron microscope Carl Zeiss EVO-40XVP. It was
equipped with an INCA Energy 350 system. This system allows determining the
chemical homogeneity of materials by X-ray energy-dispersive spectroscopy (EDS)
microanalysis. The detailed microstructural analysis was performed using a scanning
transmission electron microscope (STEM) Hitachi-HD2700 with the Cs corrector,
which was used to study nanostructural changes in materials. Imaging was performed
using an annular dark field (ADF). The electron energy loss spectroscopy (EELS)
technique was used for chemical analysis of nanoparticles.
Based on the analysis of nano- and microstructure, the changes in the nanostructure of the material during the high-temperature (600 °C) reduction and reoxidation
have been modeled and explained.
Y. Kharchenko et al.
Fig. 1 Diagrams of a a
one-time reduction mode and
b a redox cycle mode
σ f =
3P max
2π · t 2
(1 − ν) ·
D
2
S − D
2
L
2 · D 2 + (1 + ν) · ln
D S
D L
,
(1)
where P max is the maximum load [N], D and t are the specimen diameter and thickness, respectively [mm], ν is Poisson’s ratio, D L is the diameter of the loading ring
[mm], and D S is the diameter of the supporting ring [mm].
For the quantitative evaluation of changes in the mechanical properties of materials, the relative stiffness characteristic E/E 0 was proposed. Here, E 0 and E are values
of Young’s modulus for the material in as-sintered state and after corresponding
treatment. Using the slopes of linear sections of “stress–flexure” diagrams, we determined the characteristic E/E 0 as the tangent ratio for the material in the treated and
as-sintered state.
We used the four-point method [19] for determining the specific electrical
conductivity σ of specimens at 20 °C in air.
The morphology of the fracture surface and the material microstructure were
studied using a scanning electron microscope Carl Zeiss EVO-40XVP. It was
equipped with an INCA Energy 350 system. This system allows determining the
chemical homogeneity of materials by X-ray energy-dispersive spectroscopy (EDS)
microanalysis. The detailed microstructural analysis was performed using a scanning
transmission electron microscope (STEM) Hitachi-HD2700 with the Cs corrector,
which was used to study nanostructural changes in materials. Imaging was performed
using an annular dark field (ADF). The electron energy loss spectroscopy (EELS)
technique was used for chemical analysis of nanoparticles.
Based on the analysis of nano- and microstructure, the changes in the nanostructure of the material during the high-temperature (600 °C) reduction and reoxidation
have been modeled and explained.