

186
Yu. Kotsiuba et al.
4 Results and Discussion
This section shows the results of filtering the obtained phase maps with two filters.
In addition to the proposed filter, we consider here the filter described in [22]. To
compare both filters, the standard deviation value obtained from the filtering error
was calculated.
In work [22], the filtration is carried out in the frequency domain using the Fourier
transform. A threshold filter is applied to the spectrum of the sine pattern. The
threshold value is determined statistically, calculating a percentile value below which
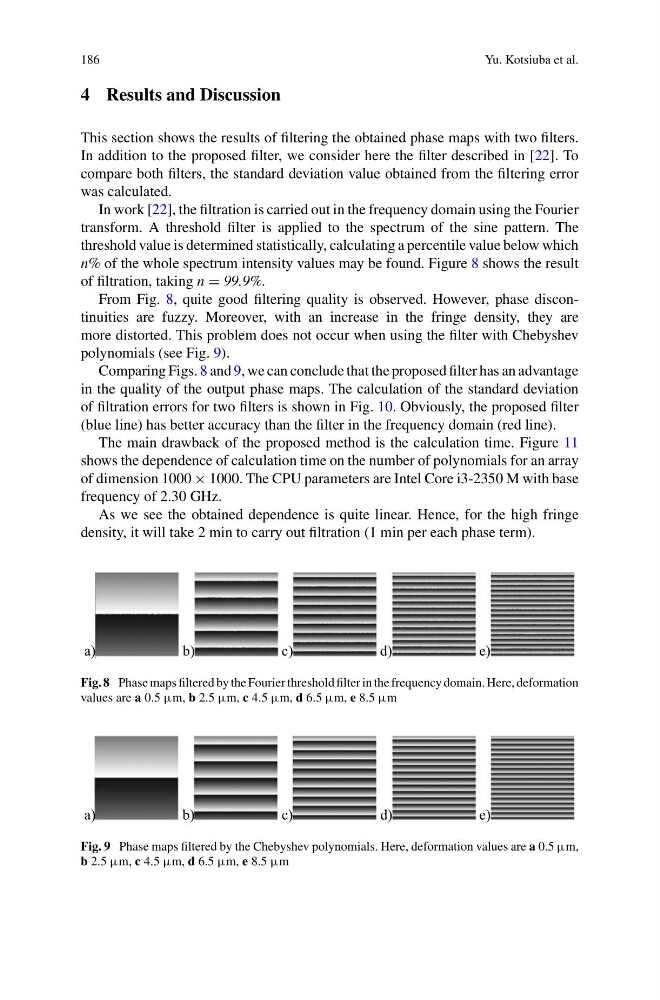
n% of the whole spectrum intensity values may be found. Figure 8 shows the result
of filtration, taking n = 99.9%.
From Fig. 8, quite good filtering quality is observed. However, phase discontinuities are fuzzy. Moreover, with an increase in the fringe density, they are
more distorted. This problem does not occur when using the filter with Chebyshev
polynomials (see Fig. 9).
Comparing Figs. 8 and 9, we can conclude that the proposed filter has an advantage
in the quality of the output phase maps. The calculation of the standard deviation
of filtration errors for two filters is shown in Fig. 10. Obviously, the proposed filter
(blue line) has better accuracy than the filter in the frequency domain (red line).
The main drawback of the proposed method is the calculation time. Figure 11
shows the dependence of calculation time on the number of polynomials for an array
of dimension 1000 × 1000. The CPU parameters are Intel Core i3-2350 M with base
frequency of 2.30 GHz.
As we see the obtained dependence is quite linear. Hence, for the high fringe
density, it will take 2 min to carry out filtration (1 min per each phase term).
а)
b)
c)
d)
e)
Fig. 8 Phase maps filtered by the Fourier threshold filter in the frequency domain. Here, deformation
values are a 0.5 μm, b 2.5 μm, c 4.5 μm, d 6.5 μm, e 8.5 μm
а)
b)
c)
d)
e)
Fig. 9 Phase maps filtered by the Chebyshev polynomials. Here, deformation values are a 0.5 μm,
b 2.5 μm, c 4.5 μm, d 6.5 μm, e 8.5 μm
Yu. Kotsiuba et al.
4 Results and Discussion
This section shows the results of filtering the obtained phase maps with two filters.
In addition to the proposed filter, we consider here the filter described in [22]. To
compare both filters, the standard deviation value obtained from the filtering error
was calculated.
In work [22], the filtration is carried out in the frequency domain using the Fourier
transform. A threshold filter is applied to the spectrum of the sine pattern. The
threshold value is determined statistically, calculating a percentile value below which
n% of the whole spectrum intensity values may be found. Figure 8 shows the result
of filtration, taking n = 99.9%.
From Fig. 8, quite good filtering quality is observed. However, phase discontinuities are fuzzy. Moreover, with an increase in the fringe density, they are
more distorted. This problem does not occur when using the filter with Chebyshev
polynomials (see Fig. 9).
Comparing Figs. 8 and 9, we can conclude that the proposed filter has an advantage
in the quality of the output phase maps. The calculation of the standard deviation
of filtration errors for two filters is shown in Fig. 10. Obviously, the proposed filter
(blue line) has better accuracy than the filter in the frequency domain (red line).
The main drawback of the proposed method is the calculation time. Figure 11
shows the dependence of calculation time on the number of polynomials for an array
of dimension 1000 × 1000. The CPU parameters are Intel Core i3-2350 M with base
frequency of 2.30 GHz.
As we see the obtained dependence is quite linear. Hence, for the high fringe
density, it will take 2 min to carry out filtration (1 min per each phase term).
а)
b)
c)
d)
e)
Fig. 8 Phase maps filtered by the Fourier threshold filter in the frequency domain. Here, deformation
values are a 0.5 μm, b 2.5 μm, c 4.5 μm, d 6.5 μm, e 8.5 μm
а)
b)
c)
d)
e)
Fig. 9 Phase maps filtered by the Chebyshev polynomials. Here, deformation values are a 0.5 μm,
b 2.5 μm, c 4.5 μm, d 6.5 μm, e 8.5 μm