

100
Y. S. Dzyazko et al.
contact porosimetry (MSCP) is recommended. This technique is recognized by the
IUPAC [58]. The MSCP gives a possibility to obtain pore size distributions in a very
wide interval (r = 1 nm−100 μm).
Gravimetric measurements of the content of working liquid (water as well as
octane, which is ideally wetting medium) in the sample are performed. Similar procedure is provided for porous standards, which are attached to the tested sample. Only
the data for the state of capillary equilibrium are considered. The liquid amount
in the system of standards and tested sample is varied by impregnation and drying.
After the achievement of thermodynamic equilibrium, the liquid in contacting porous
samples is characterized by the same chemical potential. The pore size distributions
for the tested sample are plotted taking the known distribution for the standards into
consideration. Theoretical approaches and practical details of the MSCP are given
in [59–62].
Both GO and rGO are characterized by high specific surface area: the data of
560−900 m
2 g
−1 have been reported [63, 64]. These results were obtained using
BET measurements, which involve adsorption and desorption of nitrogen. It should
be stressed that the mentioned data are lower than the theoretical value for completely
isolated graphene sheets (≈2600 m
2 g
−1 [12]). Under low temperature, nitrogen
molecules cannot penetrate between agglomerated, curled, and overlapped graphene
sheets. The MSCP gives the values of 2000−2400 m
2 g
−1 due to high disjoining
pressure of octane [65], though its molecules are larger compared with nitrogen.
Octane completely wets graphene penetrating between sheets. Similar behavior has
been found for graphene in water medium.
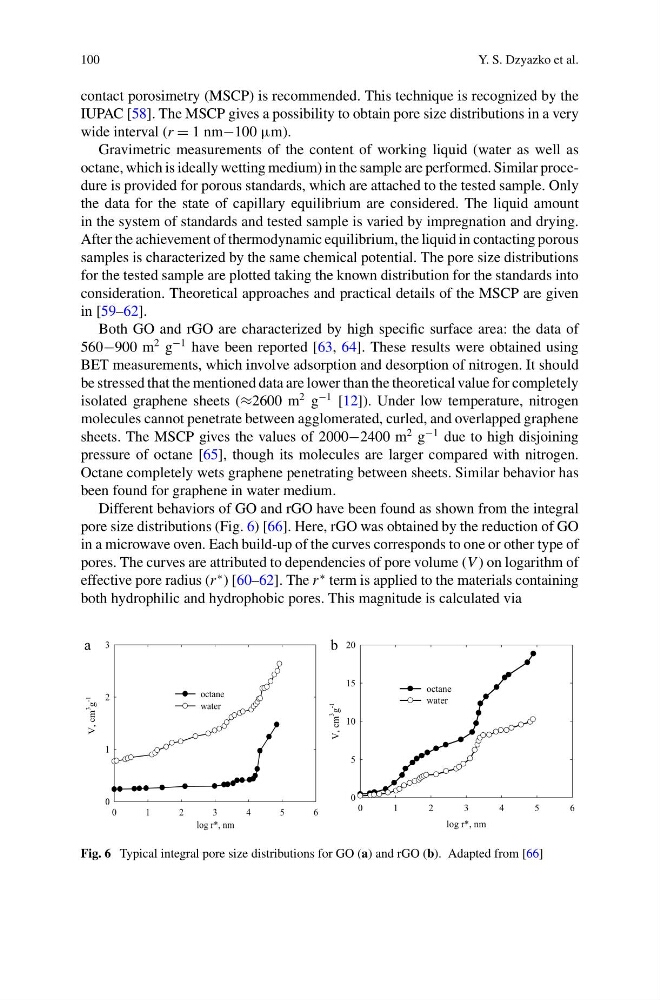
Different behaviors of GO and rGO have been found as shown from the integral
pore size distributions (Fig. 6) [66]. Here, rGO was obtained by the reduction of GO
in a microwave oven. Each build-up of the curves corresponds to one or other type of
pores. The curves are attributed to dependencies of pore volume (V ) on logarithm of
effective pore radius (r
∗ ) [60–62]. The r
∗ term is applied to the materials containing
both hydrophilic and hydrophobic pores. This magnitude is calculated via
0
1
2
3
4
5
6
0
1
2
3
octane
water
V, cm
3
g
-1
log r*, nm
a
log r*, nm
0
1
2
3
4
5
6
V, cm
3
g
-1
0
5
10
15
20
octane
water
b
Fig. 6 Typical integral pore size distributions for GO (a) and rGO (b). Adapted from [66]
Y. S. Dzyazko et al.
contact porosimetry (MSCP) is recommended. This technique is recognized by the
IUPAC [58]. The MSCP gives a possibility to obtain pore size distributions in a very
wide interval (r = 1 nm−100 μm).
Gravimetric measurements of the content of working liquid (water as well as
octane, which is ideally wetting medium) in the sample are performed. Similar procedure is provided for porous standards, which are attached to the tested sample. Only
the data for the state of capillary equilibrium are considered. The liquid amount
in the system of standards and tested sample is varied by impregnation and drying.
After the achievement of thermodynamic equilibrium, the liquid in contacting porous
samples is characterized by the same chemical potential. The pore size distributions
for the tested sample are plotted taking the known distribution for the standards into
consideration. Theoretical approaches and practical details of the MSCP are given
in [59–62].
Both GO and rGO are characterized by high specific surface area: the data of
560−900 m
2 g
−1 have been reported [63, 64]. These results were obtained using
BET measurements, which involve adsorption and desorption of nitrogen. It should
be stressed that the mentioned data are lower than the theoretical value for completely
isolated graphene sheets (≈2600 m
2 g
−1 [12]). Under low temperature, nitrogen
molecules cannot penetrate between agglomerated, curled, and overlapped graphene
sheets. The MSCP gives the values of 2000−2400 m
2 g
−1 due to high disjoining
pressure of octane [65], though its molecules are larger compared with nitrogen.
Octane completely wets graphene penetrating between sheets. Similar behavior has
been found for graphene in water medium.
Different behaviors of GO and rGO have been found as shown from the integral
pore size distributions (Fig. 6) [66]. Here, rGO was obtained by the reduction of GO
in a microwave oven. Each build-up of the curves corresponds to one or other type of
pores. The curves are attributed to dependencies of pore volume (V ) on logarithm of
effective pore radius (r
∗ ) [60–62]. The r
∗ term is applied to the materials containing
both hydrophilic and hydrophobic pores. This magnitude is calculated via
0
1
2
3
4
5
6
0
1
2
3
octane
water
V, cm
3
g
-1
log r*, nm
a
log r*, nm
0
1
2
3
4
5
6
V, cm
3
g
-1
0
5
10
15
20
octane
water
b
Fig. 6 Typical integral pore size distributions for GO (a) and rGO (b). Adapted from [66]