

4.4 Time Domain Analysis: Proportional Damping
97
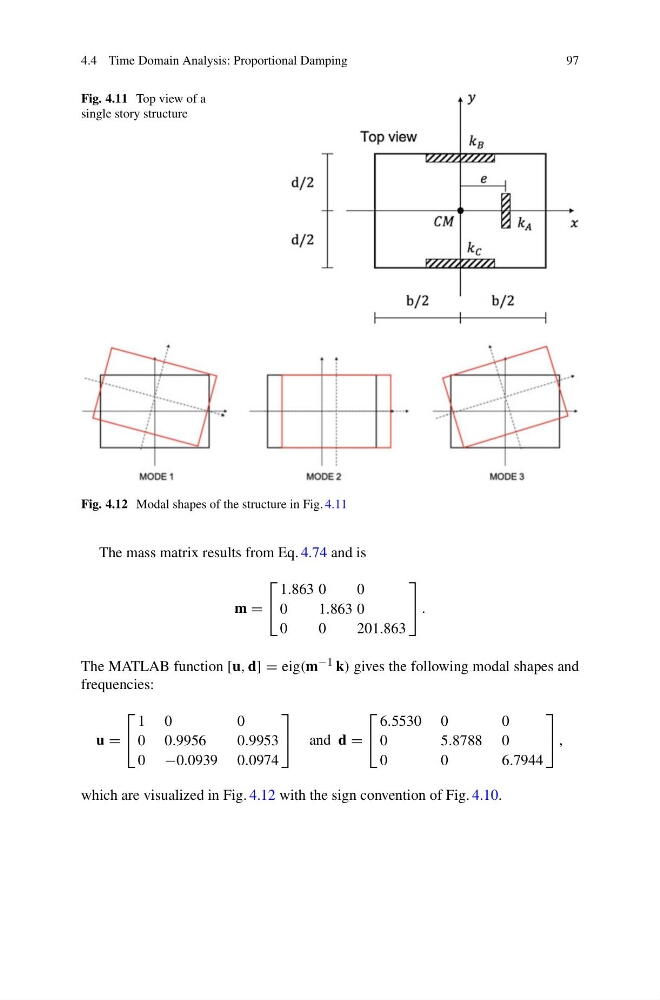
Fig. 4.11 Top view of a
single story structure
Fig. 4.12 Modal shapes of the structure in Fig. 4.11
The mass matrix results from Eq. 4.74 and is
m =
⎡
⎣
1.863 0
0
0
1.863 0
0
0
201.863
⎤
⎦ .
The MATLAB function [u, d] = eig(m −1 k) gives the following modal shapes and
frequencies:
u =
⎡
⎣
1 0
0
0 0.9956
0.9953
0 −0.0939 0.0974
⎤
⎦ and d =
⎡
⎣
6.5530 0
0
0
5 .8788 0
0
0
6 .7944
⎤
⎦ ,
which are visualized in Fig. 4.12 with the sign convention of Fig. 4.10.
97
Fig. 4.11 Top view of a
single story structure
Fig. 4.12 Modal shapes of the structure in Fig. 4.11
The mass matrix results from Eq. 4.74 and is
m =
⎡
⎣
1.863 0
0
0
1.863 0
0
0
201.863
⎤
⎦ .
The MATLAB function [u, d] = eig(m −1 k) gives the following modal shapes and
frequencies:
u =
⎡
⎣
1 0
0
0 0.9956
0.9953
0 −0.0939 0.0974
⎤
⎦ and d =
⎡
⎣
6.5530 0
0
0
5 .8788 0
0
0
6 .7944
⎤
⎦ ,
which are visualized in Fig. 4.12 with the sign convention of Fig. 4.10.