

480
B. D. Vasyliv et al.
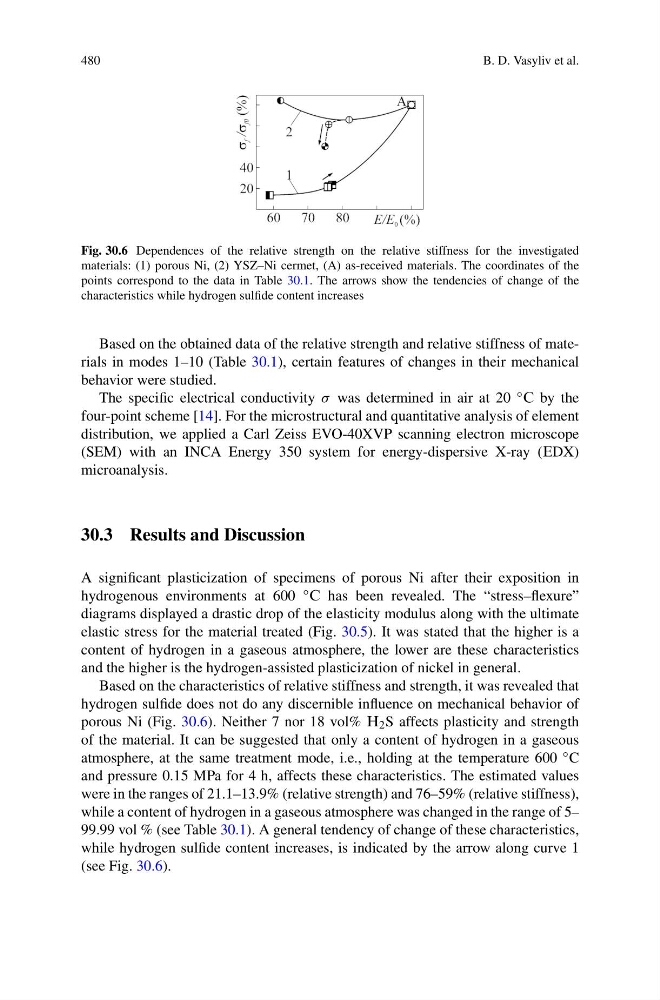
Fig. 30.6 Dependences of the relative strength on the relative stiffness for the investigated
materials: (1) porous Ni, (2) YSZ–Ni cermet, (A) as-received materials. The coordinates of the
points correspond to the data in Table 30.1. The arrows show the tendencies of change of the
characteristics while hydrogen sulfide content increases
Based on the obtained data of the relative strength and relative stiffness of materials in modes 1–10 (Table 30.1), certain features of changes in their mechanical
behavior were studied.
The specific electrical conductivity σ was determined in air at 20 ◦ ´ by the
four-point scheme [14]. For the microstructural and quantitative analysis of element
distribution, we applied a Carl Zeiss EVO-40XVP scanning electron microscope
(SEM) with an INCA Energy 350 system for energy-dispersive X-ray (¨DX)
microanalysis.
30.3 Results and Discussion
A significant plasticization of specimens of porous Ni after their exposition in
hydrogenous environments at 600 ◦ ´ has been revealed. The “stress–flexure”
diagrams displayed a drastic drop of the elasticity modulus along with the ultimate
elastic stress for the material treated (Fig. 30.5). It was stated that the higher is a
content of hydrogen in a gaseous atmosphere, the lower are these characteristics
and the higher is the hydrogen-assisted plasticization of nickel in general.
Based on the characteristics of relative stiffness and strength, it was revealed that
hydrogen sulfide does not do any discernible influence on mechanical behavior of
porous Ni (Fig. 30.6). Neither 7 nor 18 vol% ° 2 S affects plasticity and strength
of the material. It can be suggested that only a content of hydrogen in a gaseous
atmosphere, at the same treatment mode, i.e., holding at the temperature 600 ◦ C
and pressure 0.15 MPa for 4 h, affects these characteristics. The estimated values
were in the ranges of 21.1–13.9% (relative strength) and 76–59% (relative stiffness),
while a content of hydrogen in a gaseous atmosphere was changed in the range of 5–
99.99 vol % (see Table 30.1). A general tendency of change of these characteristics,
while hydrogen sulfide content increases, is indicated by the arrow along curve 1
(see Fig. 30.6).
B. D. Vasyliv et al.
Fig. 30.6 Dependences of the relative strength on the relative stiffness for the investigated
materials: (1) porous Ni, (2) YSZ–Ni cermet, (A) as-received materials. The coordinates of the
points correspond to the data in Table 30.1. The arrows show the tendencies of change of the
characteristics while hydrogen sulfide content increases
Based on the obtained data of the relative strength and relative stiffness of materials in modes 1–10 (Table 30.1), certain features of changes in their mechanical
behavior were studied.
The specific electrical conductivity σ was determined in air at 20 ◦ ´ by the
four-point scheme [14]. For the microstructural and quantitative analysis of element
distribution, we applied a Carl Zeiss EVO-40XVP scanning electron microscope
(SEM) with an INCA Energy 350 system for energy-dispersive X-ray (¨DX)
microanalysis.
30.3 Results and Discussion
A significant plasticization of specimens of porous Ni after their exposition in
hydrogenous environments at 600 ◦ ´ has been revealed. The “stress–flexure”
diagrams displayed a drastic drop of the elasticity modulus along with the ultimate
elastic stress for the material treated (Fig. 30.5). It was stated that the higher is a
content of hydrogen in a gaseous atmosphere, the lower are these characteristics
and the higher is the hydrogen-assisted plasticization of nickel in general.
Based on the characteristics of relative stiffness and strength, it was revealed that
hydrogen sulfide does not do any discernible influence on mechanical behavior of
porous Ni (Fig. 30.6). Neither 7 nor 18 vol% ° 2 S affects plasticity and strength
of the material. It can be suggested that only a content of hydrogen in a gaseous
atmosphere, at the same treatment mode, i.e., holding at the temperature 600 ◦ C
and pressure 0.15 MPa for 4 h, affects these characteristics. The estimated values
were in the ranges of 21.1–13.9% (relative strength) and 76–59% (relative stiffness),
while a content of hydrogen in a gaseous atmosphere was changed in the range of 5–
99.99 vol % (see Table 30.1). A general tendency of change of these characteristics,
while hydrogen sulfide content increases, is indicated by the arrow along curve 1
(see Fig. 30.6).