

470
H. Klym et al.
0.35
0.36
0.37
0.38
0.39
4
3
2
Cu
0.1
Ni
0.8
Co
0.2
Mn
1.9
O
4
10% NiO
12% NiO
8% NiO
t
2
, ns
1% NiO
1
Sample batch
0.12
0.14
0.16
0.18
0.20
0.22
12% NiO
10% NiO
8% NiO
1% NiO
I
2
, a.u.
4
3
2
1
Sample batch
0.4
0.5
0.6
12% NiO
10% NiO
1% NiO
8% NiO
k
d
, ns
-1
4
3
2
1
Sample batch
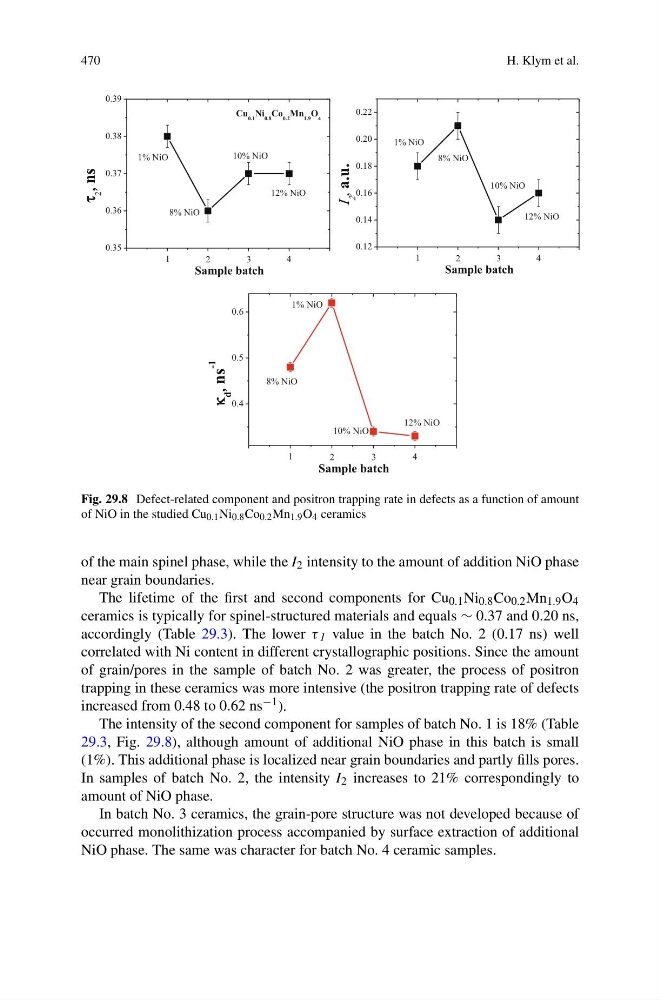
Fig. 29.8 Defect-related component and positron trapping rate in defects as a function of amount
of NiO in the studied Cu 0.1 Ni 0.8 Co 0.2 Mn 1.9 O 4 ceramics
of the main spinel phase, while the I 2 intensity to the amount of addition NiO phase
near grain boundaries.
The lifetime of the first and second components for Cu 0.1 Ni 0.8 Co 0.2 Mn 1.9 O 4
ceramics is typically for spinel-structured materials and equals ∼ 0.37 and 0.20 ns,
accordingly (Table 29.3). The lower τ 1 value in the batch No. 2 (0.17 ns) well
correlated with Ni content in different crystallographic positions. Since the amount
of grain/pores in the sample of batch No. 2 was greater, the process of positron
trapping in these ceramics was more intensive (the positron trapping rate of defects
increased from 0.48 to 0.62 ns −1 ).
The intensity of the second component for samples of batch No. 1 is 18% (Table
29.3, Fig. 29.8), although amount of additional NiO phase in this batch is small
(1%). This additional phase is localized near grain boundaries and partly fills pores.
In samples of batch No. 2, the intensity I 2 increases to 21% correspondingly to
amount of NiO phase.
In batch No. 3 ceramics, the grain-pore structure was not developed because of
occurred monolithization process accompanied by surface extraction of additional
NiO phase. The same was character for batch No. 4 ceramic samples.
H. Klym et al.
0.35
0.36
0.37
0.38
0.39
4
3
2
Cu
0.1
Ni
0.8
Co
0.2
Mn
1.9
O
4
10% NiO
12% NiO
8% NiO
t
2
, ns
1% NiO
1
Sample batch
0.12
0.14
0.16
0.18
0.20
0.22
12% NiO
10% NiO
8% NiO
1% NiO
I
2
, a.u.
4
3
2
1
Sample batch
0.4
0.5
0.6
12% NiO
10% NiO
1% NiO
8% NiO
k
d
, ns
-1
4
3
2
1
Sample batch
Fig. 29.8 Defect-related component and positron trapping rate in defects as a function of amount
of NiO in the studied Cu 0.1 Ni 0.8 Co 0.2 Mn 1.9 O 4 ceramics
of the main spinel phase, while the I 2 intensity to the amount of addition NiO phase
near grain boundaries.
The lifetime of the first and second components for Cu 0.1 Ni 0.8 Co 0.2 Mn 1.9 O 4
ceramics is typically for spinel-structured materials and equals ∼ 0.37 and 0.20 ns,
accordingly (Table 29.3). The lower τ 1 value in the batch No. 2 (0.17 ns) well
correlated with Ni content in different crystallographic positions. Since the amount
of grain/pores in the sample of batch No. 2 was greater, the process of positron
trapping in these ceramics was more intensive (the positron trapping rate of defects
increased from 0.48 to 0.62 ns −1 ).
The intensity of the second component for samples of batch No. 1 is 18% (Table
29.3, Fig. 29.8), although amount of additional NiO phase in this batch is small
(1%). This additional phase is localized near grain boundaries and partly fills pores.
In samples of batch No. 2, the intensity I 2 increases to 21% correspondingly to
amount of NiO phase.
In batch No. 3 ceramics, the grain-pore structure was not developed because of
occurred monolithization process accompanied by surface extraction of additional
NiO phase. The same was character for batch No. 4 ceramic samples.