

29 Structural Study of the Modified Cu 0.4 Co 0.4 Ni 0.4 Mn 1.8 O 4 . . .
467
As it was noted [20], positrons have a preference to annihilate in octahedral
vacancy sites as it follows from charge density distribution in partially
inverted spinel structures. But the calculated ratio between the first component
inputs in the PAL spectra for previously studied MgAl 2 O 4 ceramics [20, 31]
and Cu 0.4 Co 0.4 Ni 0.4 Mn 1.8 O 4 ceramics (0.78) is closer to the ratio between
corresponding volumes of tetrahedral vacancies (0.76) rather than octahedral
ones (0.69). Consequently, in the studied Cu 0.4 Co 0.4 Ni 0.4 Mn 1.8 O 4 ceramics in
contrast to nanocrystalline ferrites [14], positron trapping in tetrahedral vacancies
predominates in the first PAL component. The positron trapping in octahedral
vacancies is character to inverse spinel structure.
It is evident that octahedral monovacancies themselves do not play a decisive
role in the second component of PAL spectra. This component is associated with
more extended agglomerates such as vacancy-like clusters and nanovoids. They
appear, as a rule, near grain boundaries, where ceramic structure is more defective.
The characteristic volumes of these clusters are larger in ceramics with a more
stretched pore structure. In seats where ceramics are composed of very small grains
with divaricated grain boundaries and tiny pores, the positrons are prepped more
effective.
Recently, PAL spectroscopy started to be used as an alternative porosimetry
technique to characterize the local free volumes first of all in both open and closed
nanopores [14, 32, 33–35]. The PAL method is particularly effective when Ps is
formed. In disordered solids, Ps is usually organized in two ground states (p-Ps and
o-Ps) and localized in the pores and free volumes [33–35]. Usually, quantification
is based on the analysis of o-Ps lifetime (the lifetimes of the third component
τ 3 in Cu 0.4 Co 0.4 Ni 0.4 Mn 1.8 O 4 ceramics correspond to o-Ps lifetime). The o-Ps
“pick-off” annihilation depends on the size of holes and gives additional important
information on the void structure of the materials [35]. Despite small I 3 intensity for
Cu 0.4 Co 0.4 Ni 0.4 Mn 1.8 O 4 ceramics, it is possible to estimate the average nanopore
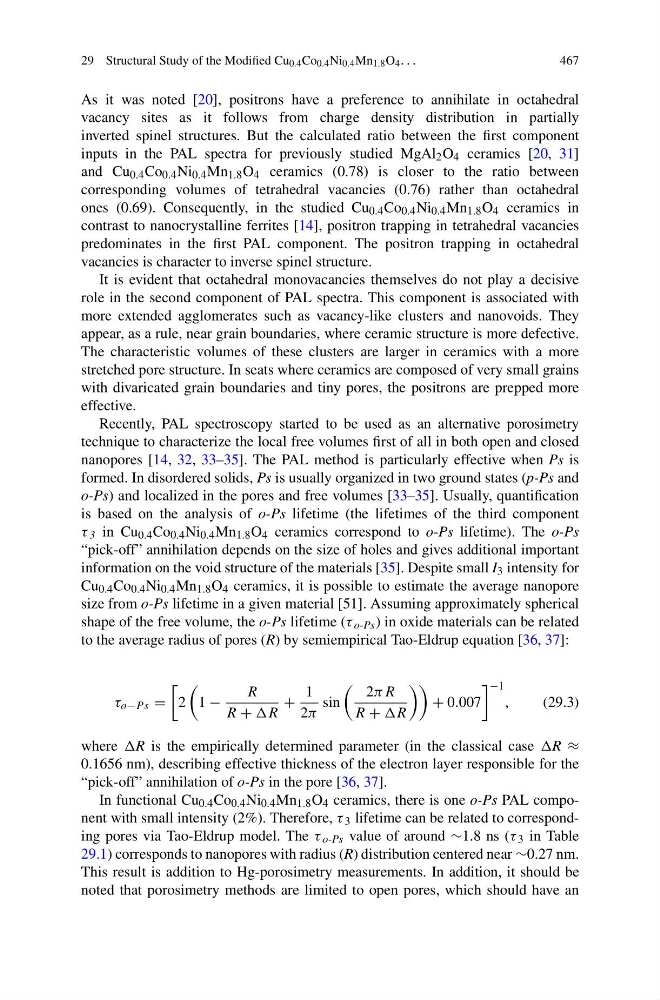
size from o-Ps lifetime in a given material [51]. Assuming approximately spherical
shape of the free volume, the o-Ps lifetime (τ o-Ps ) in oxide materials can be related
to the average radius of pores (R) by semiempirical Tao-Eldrup equation [36, 37]:
τ o−P s =
2
1 −
R
R + R
+
1
2π
sin
2πR
R + R
+ 0.007
−1
,
(29.3)
where R is the empirically determined parameter (in the classical case R ≈
0.1656 nm), describing effective thickness of the electron layer responsible for the
“pick-off” annihilation of o-Ps in the pore [36, 37].
In functional Cu 0.4 Co 0.4 Ni 0.4 Mn 1.8 O 4 ceramics, there is one o-Ps PAL component with small intensity (2%). Therefore, τ 3 lifetime can be related to corresponding pores via Tao-Eldrup model. The τ o-Ps value of around ∼1.8 ns (τ 3 in Table
29.1) corresponds to nanopores with radius (R) distribution centered near ∼0.27 nm.
This result is addition to Hg-porosimetry measurements. In addition, it should be
noted that porosimetry methods are limited to open pores, which should have an
467
As it was noted [20], positrons have a preference to annihilate in octahedral
vacancy sites as it follows from charge density distribution in partially
inverted spinel structures. But the calculated ratio between the first component
inputs in the PAL spectra for previously studied MgAl 2 O 4 ceramics [20, 31]
and Cu 0.4 Co 0.4 Ni 0.4 Mn 1.8 O 4 ceramics (0.78) is closer to the ratio between
corresponding volumes of tetrahedral vacancies (0.76) rather than octahedral
ones (0.69). Consequently, in the studied Cu 0.4 Co 0.4 Ni 0.4 Mn 1.8 O 4 ceramics in
contrast to nanocrystalline ferrites [14], positron trapping in tetrahedral vacancies
predominates in the first PAL component. The positron trapping in octahedral
vacancies is character to inverse spinel structure.
It is evident that octahedral monovacancies themselves do not play a decisive
role in the second component of PAL spectra. This component is associated with
more extended agglomerates such as vacancy-like clusters and nanovoids. They
appear, as a rule, near grain boundaries, where ceramic structure is more defective.
The characteristic volumes of these clusters are larger in ceramics with a more
stretched pore structure. In seats where ceramics are composed of very small grains
with divaricated grain boundaries and tiny pores, the positrons are prepped more
effective.
Recently, PAL spectroscopy started to be used as an alternative porosimetry
technique to characterize the local free volumes first of all in both open and closed
nanopores [14, 32, 33–35]. The PAL method is particularly effective when Ps is
formed. In disordered solids, Ps is usually organized in two ground states (p-Ps and
o-Ps) and localized in the pores and free volumes [33–35]. Usually, quantification
is based on the analysis of o-Ps lifetime (the lifetimes of the third component
τ 3 in Cu 0.4 Co 0.4 Ni 0.4 Mn 1.8 O 4 ceramics correspond to o-Ps lifetime). The o-Ps
“pick-off” annihilation depends on the size of holes and gives additional important
information on the void structure of the materials [35]. Despite small I 3 intensity for
Cu 0.4 Co 0.4 Ni 0.4 Mn 1.8 O 4 ceramics, it is possible to estimate the average nanopore
size from o-Ps lifetime in a given material [51]. Assuming approximately spherical
shape of the free volume, the o-Ps lifetime (τ o-Ps ) in oxide materials can be related
to the average radius of pores (R) by semiempirical Tao-Eldrup equation [36, 37]:
τ o−P s =
2
1 −
R
R + R
+
1
2π
sin
2πR
R + R
+ 0.007
−1
,
(29.3)
where R is the empirically determined parameter (in the classical case R ≈
0.1656 nm), describing effective thickness of the electron layer responsible for the
“pick-off” annihilation of o-Ps in the pore [36, 37].
In functional Cu 0.4 Co 0.4 Ni 0.4 Mn 1.8 O 4 ceramics, there is one o-Ps PAL component with small intensity (2%). Therefore, τ 3 lifetime can be related to corresponding pores via Tao-Eldrup model. The τ o-Ps value of around ∼1.8 ns (τ 3 in Table
29.1) corresponds to nanopores with radius (R) distribution centered near ∼0.27 nm.
This result is addition to Hg-porosimetry measurements. In addition, it should be
noted that porosimetry methods are limited to open pores, which should have an