

448
A. Maizelis and B. Bairachniy
Analysis of the transients was performed by comparing the experimental transients to the dimensionless theoretical curves for instantaneous and progressive
3D nucleation and growth with diffusion control proposed by B. Scharifker and
G. Hills [51], in order to determine the nucleation mechanism. The models for
instantaneous and progressive nucleation are given by Eqs. (28.2) and (28.3),
respectively [50]:
j 2
j 2
max
=
1.9542
t/t max
{1 − exp[−1, 2564(t/ max )]}
2 ,
(28.2)
j 2
j 2
max
=
1.2254
t/t max
{1 − exp[−2, 3367(t max )
2
]}
2 ,
(28.3)
where j and j max are the current density at current time and maximum current
density on the current transients, mA/cm 2 , and t and t max are the current time and
the time corresponding to the current maximum, s. The current transients from
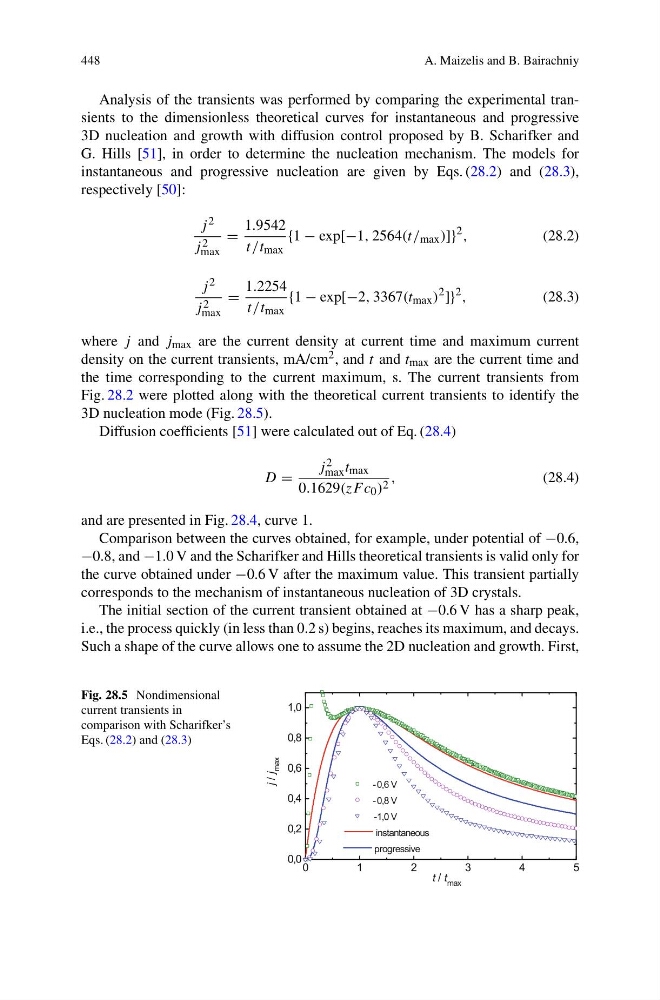
Fig. 28.2 were plotted along with the theoretical current transients to identify the
3D nucleation mode (Fig. 28.5).
Diffusion coefficients [51] were calculated out of Eq. (28.4)
D =
j 2
max t max
0.1629(zF c 0 ) 2 ,
(28.4)
and are presented in Fig. 28.4, curve 1.
Comparison between the curves obtained, for example, under potential of −0.6,
−0.8, and −1.0 V and the Scharifker and Hills theoretical transients is valid only for
the curve obtained under −0.6 V after the maximum value. This transient partially
corresponds to the mechanism of instantaneous nucleation of 3D crystals.
The initial section of the current transient obtained at −0.6 V has a sharp peak,
i.e., the process quickly (in less than 0.2 s) begins, reaches its maximum, and decays.
Such a shape of the curve allows one to assume the 2D nucleation and growth. First,
Fig. 28.5 Nondimensional
current transients in
comparison with Scharifker’s
Eqs. (28.2) and (28.3)
A. Maizelis and B. Bairachniy
Analysis of the transients was performed by comparing the experimental transients to the dimensionless theoretical curves for instantaneous and progressive
3D nucleation and growth with diffusion control proposed by B. Scharifker and
G. Hills [51], in order to determine the nucleation mechanism. The models for
instantaneous and progressive nucleation are given by Eqs. (28.2) and (28.3),
respectively [50]:
j 2
j 2
max
=
1.9542
t/t max
{1 − exp[−1, 2564(t/ max )]}
2 ,
(28.2)
j 2
j 2
max
=
1.2254
t/t max
{1 − exp[−2, 3367(t max )
2
]}
2 ,
(28.3)
where j and j max are the current density at current time and maximum current
density on the current transients, mA/cm 2 , and t and t max are the current time and
the time corresponding to the current maximum, s. The current transients from
Fig. 28.2 were plotted along with the theoretical current transients to identify the
3D nucleation mode (Fig. 28.5).
Diffusion coefficients [51] were calculated out of Eq. (28.4)
D =
j 2
max t max
0.1629(zF c 0 ) 2 ,
(28.4)
and are presented in Fig. 28.4, curve 1.
Comparison between the curves obtained, for example, under potential of −0.6,
−0.8, and −1.0 V and the Scharifker and Hills theoretical transients is valid only for
the curve obtained under −0.6 V after the maximum value. This transient partially
corresponds to the mechanism of instantaneous nucleation of 3D crystals.
The initial section of the current transient obtained at −0.6 V has a sharp peak,
i.e., the process quickly (in less than 0.2 s) begins, reaches its maximum, and decays.
Such a shape of the curve allows one to assume the 2D nucleation and growth. First,
Fig. 28.5 Nondimensional
current transients in
comparison with Scharifker’s
Eqs. (28.2) and (28.3)