

338
T. N. Smirnova et al.
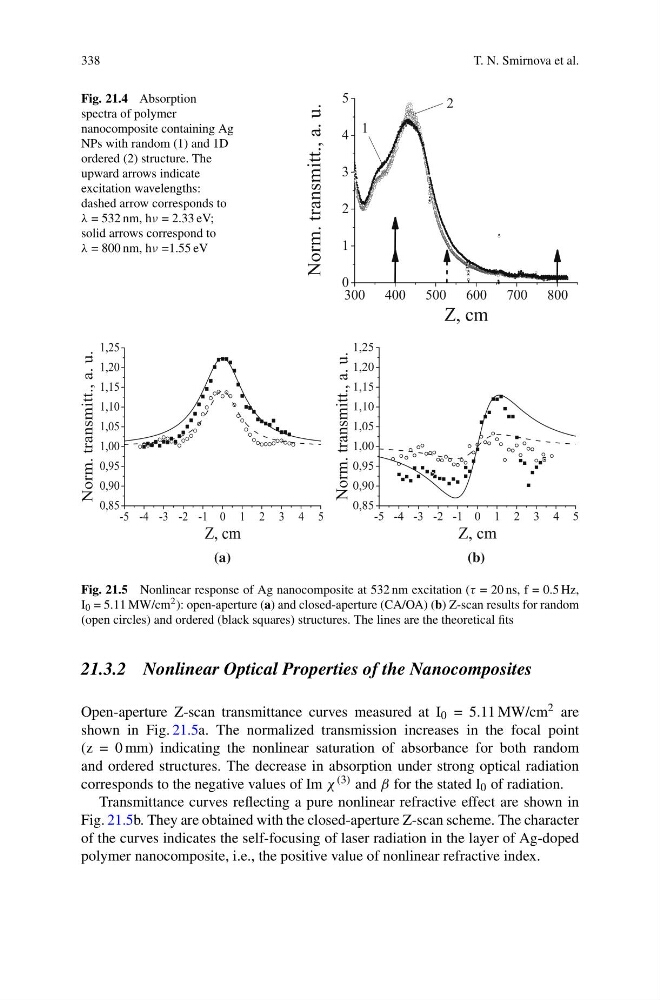
Fig. 21.4 Absorption
spectra of polymer
nanocomposite containing Ag
NPs with random (1) and 1D
ordered (2) structure. The
upward arrows indicate
excitation wavelengths:
dashed arrow corresponds to
λ = 532 nm, hν = 2.33 eV;
solid arrows correspond to
λ = 800 nm, hν =1.55 eV
(a)
(b)
Fig. 21.5 Nonlinear response of Ag nanocomposite at 532 nm excitation (τ = 20 ns, f = 0.5 Hz,
I 0 = 5.11 MW/cm 2 ): open-aperture (a) and closed-aperture (CA/OA) (b) Z-scan results for random
(open circles) and ordered (black squares) structures. The lines are the theoretical fits
21.3.2 Nonlinear Optical Properties of the Nanocomposites
Open-aperture Z-scan transmittance curves measured at I 0 = 5.11 MW/cm 2 are
shown in Fig. 21.5a. The normalized transmission increases in the focal point
(z = 0 mm) indicating the nonlinear saturation of absorbance for both random
and ordered structures. The decrease in absorption under strong optical radiation
corresponds to the negative values of Im χ (3) and β for the stated I 0 of radiation.
Transmittance curves reflecting a pure nonlinear refractive effect are shown in
Fig. 21.5b. They are obtained with the closed-aperture Z-scan scheme. The character
of the curves indicates the self-focusing of laser radiation in the layer of Ag-doped
polymer nanocomposite, i.e., the positive value of nonlinear refractive index.
T. N. Smirnova et al.
Fig. 21.4 Absorption
spectra of polymer
nanocomposite containing Ag
NPs with random (1) and 1D
ordered (2) structure. The
upward arrows indicate
excitation wavelengths:
dashed arrow corresponds to
λ = 532 nm, hν = 2.33 eV;
solid arrows correspond to
λ = 800 nm, hν =1.55 eV
(a)
(b)
Fig. 21.5 Nonlinear response of Ag nanocomposite at 532 nm excitation (τ = 20 ns, f = 0.5 Hz,
I 0 = 5.11 MW/cm 2 ): open-aperture (a) and closed-aperture (CA/OA) (b) Z-scan results for random
(open circles) and ordered (black squares) structures. The lines are the theoretical fits
21.3.2 Nonlinear Optical Properties of the Nanocomposites
Open-aperture Z-scan transmittance curves measured at I 0 = 5.11 MW/cm 2 are
shown in Fig. 21.5a. The normalized transmission increases in the focal point
(z = 0 mm) indicating the nonlinear saturation of absorbance for both random
and ordered structures. The decrease in absorption under strong optical radiation
corresponds to the negative values of Im χ (3) and β for the stated I 0 of radiation.
Transmittance curves reflecting a pure nonlinear refractive effect are shown in
Fig. 21.5b. They are obtained with the closed-aperture Z-scan scheme. The character
of the curves indicates the self-focusing of laser radiation in the layer of Ag-doped
polymer nanocomposite, i.e., the positive value of nonlinear refractive index.