

21 Nonlinear Optical Properties of Polymer Nanocomposites. . .
337
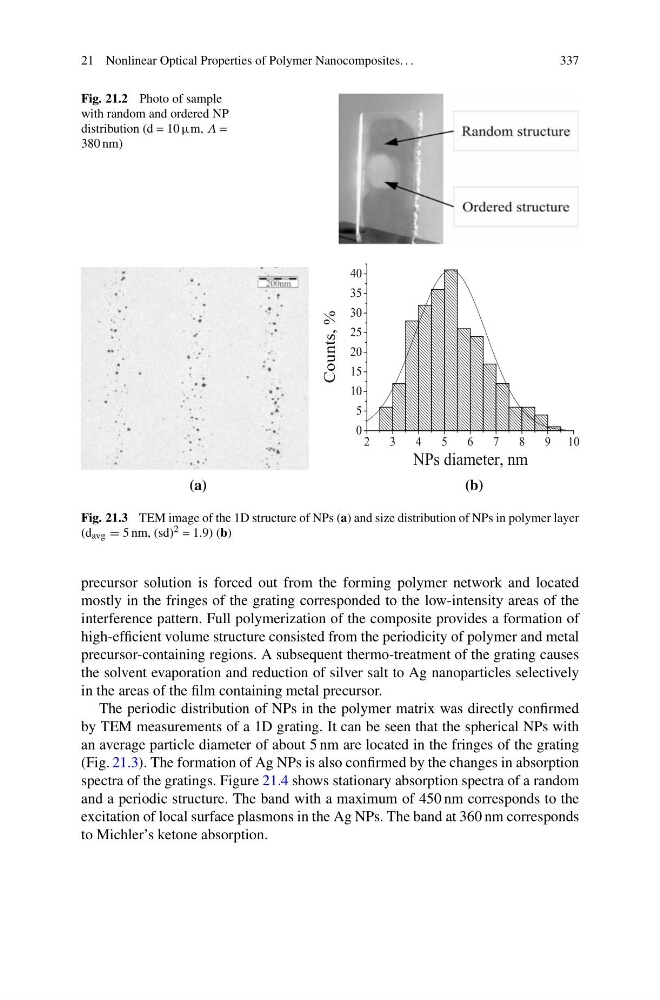
Fig. 21.2 Photo of sample
with random and ordered NP
distribution (d = 10 μm, Λ =
380 nm)
(a)
(b)
Fig. 21.3 TEM image of the 1D structure of NPs (a) and size distribution of NPs in polymer layer
(d avg = 5 nm, (sd) 2 = 1.9) (b)
precursor solution is forced out from the forming polymer network and located
mostly in the fringes of the grating corresponded to the low-intensity areas of the
interference pattern. Full polymerization of the composite provides a formation of
high-efficient volume structure consisted from the periodicity of polymer and metal
precursor-containing regions. A subsequent thermo-treatment of the grating causes
the solvent evaporation and reduction of silver salt to Ag nanoparticles selectively
in the areas of the film containing metal precursor.
The periodic distribution of NPs in the polymer matrix was directly confirmed
by TEM measurements of a 1D grating. It can be seen that the spherical NPs with
an average particle diameter of about 5 nm are located in the fringes of the grating
(Fig. 21.3). The formation of Ag NPs is also confirmed by the changes in absorption
spectra of the gratings. Figure 21.4 shows stationary absorption spectra of a random
and a periodic structure. The band with a maximum of 450 nm corresponds to the
excitation of local surface plasmons in the Ag NPs. The band at 360 nm corresponds
to Michler’s ketone absorption.
337
Fig. 21.2 Photo of sample
with random and ordered NP
distribution (d = 10 μm, Λ =
380 nm)
(a)
(b)
Fig. 21.3 TEM image of the 1D structure of NPs (a) and size distribution of NPs in polymer layer
(d avg = 5 nm, (sd) 2 = 1.9) (b)
precursor solution is forced out from the forming polymer network and located
mostly in the fringes of the grating corresponded to the low-intensity areas of the
interference pattern. Full polymerization of the composite provides a formation of
high-efficient volume structure consisted from the periodicity of polymer and metal
precursor-containing regions. A subsequent thermo-treatment of the grating causes
the solvent evaporation and reduction of silver salt to Ag nanoparticles selectively
in the areas of the film containing metal precursor.
The periodic distribution of NPs in the polymer matrix was directly confirmed
by TEM measurements of a 1D grating. It can be seen that the spherical NPs with
an average particle diameter of about 5 nm are located in the fringes of the grating
(Fig. 21.3). The formation of Ag NPs is also confirmed by the changes in absorption
spectra of the gratings. Figure 21.4 shows stationary absorption spectra of a random
and a periodic structure. The band with a maximum of 450 nm corresponds to the
excitation of local surface plasmons in the Ag NPs. The band at 360 nm corresponds
to Michler’s ketone absorption.