

15 “Polymer–Oxide” Micro-/Nanocomposites: Background and Promises
263
10
20
30
40
0,0
0,5
1,0
1,5
2,0
2,5
3,0
3,5
K 2 Eu(PO 4 )(MoO 4 )
C3
C2
C1
C0
Intensity, a.u.
2Q, degree
SC
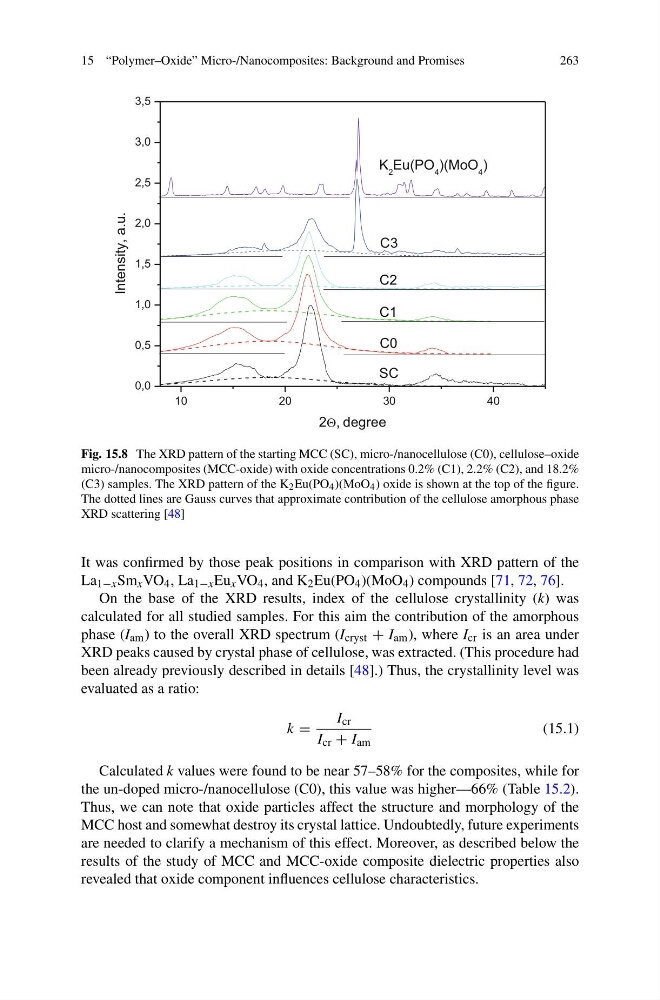
Fig. 15.8 The XRD pattern of the starting MCC (SC), micro-/nanocellulose (C0), cellulose–oxide
micro-/nanocomposites (MCC-oxide) with oxide concentrations 0.2% (C1), 2.2% (C2), and 18.2%
(C3) samples. The XRD pattern of the K 2 Eu(PO 4 )(MoO 4 ) oxide is shown at the top of the figure.
The dotted lines are Gauss curves that approximate contribution of the cellulose amorphous phase
XRD scattering [48]
It was confirmed by those peak positions in comparison with XRD pattern of the
La 1−x Sm x VO 4 , La 1−x Eu x VO 4 , and K 2 Eu(PO 4 )(MoO 4 ) compounds [71, 72, 76].
On the base of the XRD results, index of the cellulose crystallinity (k) was
calculated for all studied samples. For this aim the contribution of the amorphous
phase (I am ) to the overall XRD spectrum (I cryst + I am ), where I cr is an area under
XRD peaks caused by crystal phase of cellulose, was extracted. (This procedure had
been already previously described in details [48].) Thus, the crystallinity level was
evaluated as a ratio:
k =
I cr
I cr + I am
(15.1)
Calculated k values were found to be near 57–58% for the composites, while for
the un-doped micro-/nanocellulose (C0), this value was higher—66% (Table 15.2).
Thus, we can note that oxide particles affect the structure and morphology of the
MCC host and somewhat destroy its crystal lattice. Undoubtedly, future experiments
are needed to clarify a mechanism of this effect. Moreover, as described below the
results of the study of MCC and MCC-oxide composite dielectric properties also
revealed that oxide component influences cellulose characteristics.
263
10
20
30
40
0,0
0,5
1,0
1,5
2,0
2,5
3,0
3,5
K 2 Eu(PO 4 )(MoO 4 )
C3
C2
C1
C0
Intensity, a.u.
2Q, degree
SC
Fig. 15.8 The XRD pattern of the starting MCC (SC), micro-/nanocellulose (C0), cellulose–oxide
micro-/nanocomposites (MCC-oxide) with oxide concentrations 0.2% (C1), 2.2% (C2), and 18.2%
(C3) samples. The XRD pattern of the K 2 Eu(PO 4 )(MoO 4 ) oxide is shown at the top of the figure.
The dotted lines are Gauss curves that approximate contribution of the cellulose amorphous phase
XRD scattering [48]
It was confirmed by those peak positions in comparison with XRD pattern of the
La 1−x Sm x VO 4 , La 1−x Eu x VO 4 , and K 2 Eu(PO 4 )(MoO 4 ) compounds [71, 72, 76].
On the base of the XRD results, index of the cellulose crystallinity (k) was
calculated for all studied samples. For this aim the contribution of the amorphous
phase (I am ) to the overall XRD spectrum (I cryst + I am ), where I cr is an area under
XRD peaks caused by crystal phase of cellulose, was extracted. (This procedure had
been already previously described in details [48].) Thus, the crystallinity level was
evaluated as a ratio:
k =
I cr
I cr + I am
(15.1)
Calculated k values were found to be near 57–58% for the composites, while for
the un-doped micro-/nanocellulose (C0), this value was higher—66% (Table 15.2).
Thus, we can note that oxide particles affect the structure and morphology of the
MCC host and somewhat destroy its crystal lattice. Undoubtedly, future experiments
are needed to clarify a mechanism of this effect. Moreover, as described below the
results of the study of MCC and MCC-oxide composite dielectric properties also
revealed that oxide component influences cellulose characteristics.