

262
S. G. Nedilko
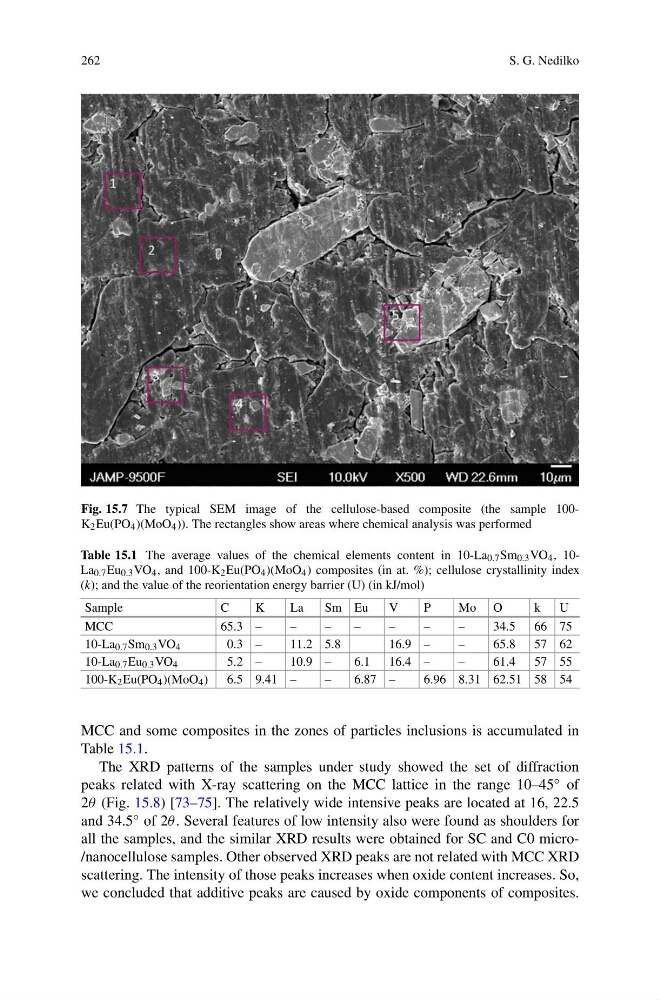
Fig. 15.7 The typical SEM image of the cellulose-based composite (the sample 100K 2 Eu(PO 4 )(MoO 4 )). The rectangles show areas where chemical analysis was performed
Table 15.1 The average values of the chemical elements content in 10-La 0.7 Sm 0.3 VO 4 , 10La 0.7 Eu 0.3 VO 4 , and 100-K 2 Eu(PO 4 )(MoO 4 ) composites (in at. %); cellulose crystallinity index
(k); and the value of the reorientation energy barrier (U) (in kJ/mol)
Sample
C
K
La
Sm Eu
V
P
Mo O
k U
MCC
65.3 –
–
–
–
–
–
–
34.5 66 75
10-La 0.7 Sm 0.3 VO 4
0.3 –
11.2 5.8
16.9 –
–
65.8 57 62
10-La 0.7 Eu 0.3 VO 4
5.2 –
10.9 –
6.1 16.4 –
–
61.4 57 55
100-K 2 Eu(PO 4 )(MoO 4 ) 6.5 9.41 –
–
6.87 –
6.96 8.31 62.51 58 54
MCC and some composites in the zones of particles inclusions is accumulated in
Table 15.1.
The XRD patterns of the samples under study showed the set of diffraction
peaks related with X-ray scattering on the MCC lattice in the range 10–45 ◦ of
2θ (Fig. 15.8) [73–75]. The relatively wide intensive peaks are located at 16, 22.5
and 34.5 ◦ of 2θ . Several features of low intensity also were found as shoulders for
all the samples, and the similar XRD results were obtained for SC and C0 micro/nanocellulose samples. Other observed XRD peaks are not related with MCC XRD
scattering. The intensity of those peaks increases when oxide content increases. So,
we concluded that additive peaks are caused by oxide components of composites.
S. G. Nedilko
Fig. 15.7 The typical SEM image of the cellulose-based composite (the sample 100K 2 Eu(PO 4 )(MoO 4 )). The rectangles show areas where chemical analysis was performed
Table 15.1 The average values of the chemical elements content in 10-La 0.7 Sm 0.3 VO 4 , 10La 0.7 Eu 0.3 VO 4 , and 100-K 2 Eu(PO 4 )(MoO 4 ) composites (in at. %); cellulose crystallinity index
(k); and the value of the reorientation energy barrier (U) (in kJ/mol)
Sample
C
K
La
Sm Eu
V
P
Mo O
k U
MCC
65.3 –
–
–
–
–
–
–
34.5 66 75
10-La 0.7 Sm 0.3 VO 4
0.3 –
11.2 5.8
16.9 –
–
65.8 57 62
10-La 0.7 Eu 0.3 VO 4
5.2 –
10.9 –
6.1 16.4 –
–
61.4 57 55
100-K 2 Eu(PO 4 )(MoO 4 ) 6.5 9.41 –
–
6.87 –
6.96 8.31 62.51 58 54
MCC and some composites in the zones of particles inclusions is accumulated in
Table 15.1.
The XRD patterns of the samples under study showed the set of diffraction
peaks related with X-ray scattering on the MCC lattice in the range 10–45 ◦ of
2θ (Fig. 15.8) [73–75]. The relatively wide intensive peaks are located at 16, 22.5
and 34.5 ◦ of 2θ . Several features of low intensity also were found as shoulders for
all the samples, and the similar XRD results were obtained for SC and C0 micro/nanocellulose samples. Other observed XRD peaks are not related with MCC XRD
scattering. The intensity of those peaks increases when oxide content increases. So,
we concluded that additive peaks are caused by oxide components of composites.