

14 Directional Synthesis of SnO 2 -Based Nanostructures for Use in Gas Sensors
239
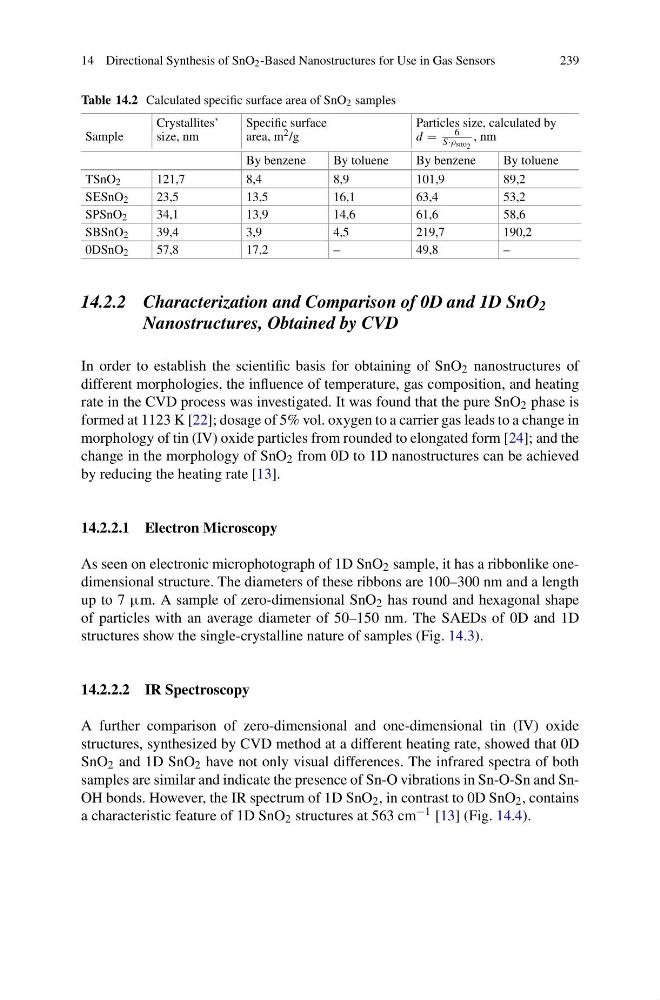
Table 14.2 Calculated specific surface area of SnO 2 samples
Crystallites’
Specific surface
Particles size, calculated by
Sample
size, nm
area, m 2 /g
d =
6
S·ρsno 2
, nm
By benzene
By toluene
By benzene
By toluene
TSnO 2
121,7
8,4
8,9
101,9
89,2
S¨SnO 2
23,5
13,5
16,1
63,4
53,2
SPSnO 2
34,1
13,9
14,6
61,6
58,6
SBSnO 2
39,4
3,9
4,5
219,7
190,2
0DSnO 2
57,8
17,2
–
49,8
–
14.2.2 Characterization and Comparison of 0D and 1D SnO 2
Nanostructures, Obtained by CVD
In order to establish the scientific basis for obtaining of SnO 2 nanostructures of
different morphologies, the influence of temperature, gas composition, and heating
rate in the CVD process was investigated. It was found that the pure SnO 2 phase is
formed at 1123 K [22]; dosage of 5% vol. oxygen to a carrier gas leads to a change in
morphology of tin (IV) oxide particles from rounded to elongated form [24]; and the
change in the morphology of SnO 2 from 0D to 1D nanostructures can be achieved
by reducing the heating rate [13].
14.2.2.1 Electron Microscopy
As seen on electronic microphotograph of 1D SnO 2 sample, it has a ribbonlike onedimensional structure. The diameters of these ribbons are 100–300 nm and a length
up to 7 μm. A sample of zero-dimensional SnO 2 has round and hexagonal shape
of particles with an average diameter of 50–150 nm. The SAEDs of 0D and 1D
structures show the single-crystalline nature of samples (Fig. 14.3).
14.2.2.2 IR Spectroscopy
A further comparison of zero-dimensional and one-dimensional tin (IV) oxide
structures, synthesized by CVD method at a different heating rate, showed that 0D
SnO 2 and 1D SnO 2 have not only visual differences. The infrared spectra of both
samples are similar and indicate the presence of Sn-O vibrations in Sn-O-Sn and SnOH bonds. However, the IR spectrum of 1D SnO 2 , in contrast to 0D SnO 2 , contains
a characteristic feature of 1D SnO 2 structures at 563 cm −1 [13] (Fig. 14.4).
239
Table 14.2 Calculated specific surface area of SnO 2 samples
Crystallites’
Specific surface
Particles size, calculated by
Sample
size, nm
area, m 2 /g
d =
6
S·ρsno 2
, nm
By benzene
By toluene
By benzene
By toluene
TSnO 2
121,7
8,4
8,9
101,9
89,2
S¨SnO 2
23,5
13,5
16,1
63,4
53,2
SPSnO 2
34,1
13,9
14,6
61,6
58,6
SBSnO 2
39,4
3,9
4,5
219,7
190,2
0DSnO 2
57,8
17,2
–
49,8
–
14.2.2 Characterization and Comparison of 0D and 1D SnO 2
Nanostructures, Obtained by CVD
In order to establish the scientific basis for obtaining of SnO 2 nanostructures of
different morphologies, the influence of temperature, gas composition, and heating
rate in the CVD process was investigated. It was found that the pure SnO 2 phase is
formed at 1123 K [22]; dosage of 5% vol. oxygen to a carrier gas leads to a change in
morphology of tin (IV) oxide particles from rounded to elongated form [24]; and the
change in the morphology of SnO 2 from 0D to 1D nanostructures can be achieved
by reducing the heating rate [13].
14.2.2.1 Electron Microscopy
As seen on electronic microphotograph of 1D SnO 2 sample, it has a ribbonlike onedimensional structure. The diameters of these ribbons are 100–300 nm and a length
up to 7 μm. A sample of zero-dimensional SnO 2 has round and hexagonal shape
of particles with an average diameter of 50–150 nm. The SAEDs of 0D and 1D
structures show the single-crystalline nature of samples (Fig. 14.3).
14.2.2.2 IR Spectroscopy
A further comparison of zero-dimensional and one-dimensional tin (IV) oxide
structures, synthesized by CVD method at a different heating rate, showed that 0D
SnO 2 and 1D SnO 2 have not only visual differences. The infrared spectra of both
samples are similar and indicate the presence of Sn-O vibrations in Sn-O-Sn and SnOH bonds. However, the IR spectrum of 1D SnO 2 , in contrast to 0D SnO 2 , contains
a characteristic feature of 1D SnO 2 structures at 563 cm −1 [13] (Fig. 14.4).