

238
S. Nahirniak et al.
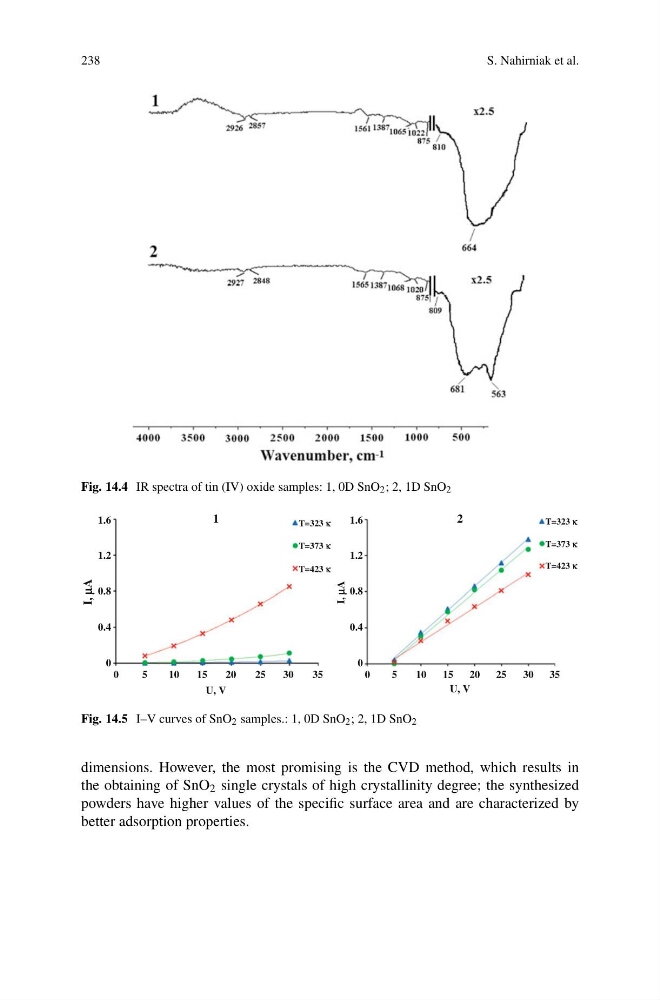
Fig. 14.4 IR spectra of tin (IV) oxide samples: 1, 0D SnO 2 ; 2, 1D SnO 2
1.6
1
2
T=323 k
T=373 k
T=423 k
T=323 k
T=373 k
T=423 k
1.2
0.8
0.4
0
0
5
10
15
20
U, V
I, mA
1.6
1.2
0.8
0.4
0
I, mA
25
30
35
0
5
10
15
20
U, V
25
30
35
Fig. 14.5 I–V curves of SnO 2 samples.: 1, 0D SnO 2 ; 2, 1D SnO 2
dimensions. However, the most promising is the CVD method, which results in
the obtaining of SnO 2 single crystals of high crystallinity degree; the synthesized
powders have higher values of the specific surface area and are characterized by
better adsorption properties.
S. Nahirniak et al.
Fig. 14.4 IR spectra of tin (IV) oxide samples: 1, 0D SnO 2 ; 2, 1D SnO 2
1.6
1
2
T=323 k
T=373 k
T=423 k
T=323 k
T=373 k
T=423 k
1.2
0.8
0.4
0
0
5
10
15
20
U, V
I, mA
1.6
1.2
0.8
0.4
0
I, mA
25
30
35
0
5
10
15
20
U, V
25
30
35
Fig. 14.5 I–V curves of SnO 2 samples.: 1, 0D SnO 2 ; 2, 1D SnO 2
dimensions. However, the most promising is the CVD method, which results in
the obtaining of SnO 2 single crystals of high crystallinity degree; the synthesized
powders have higher values of the specific surface area and are characterized by
better adsorption properties.