

236
S. Nahirniak et al.
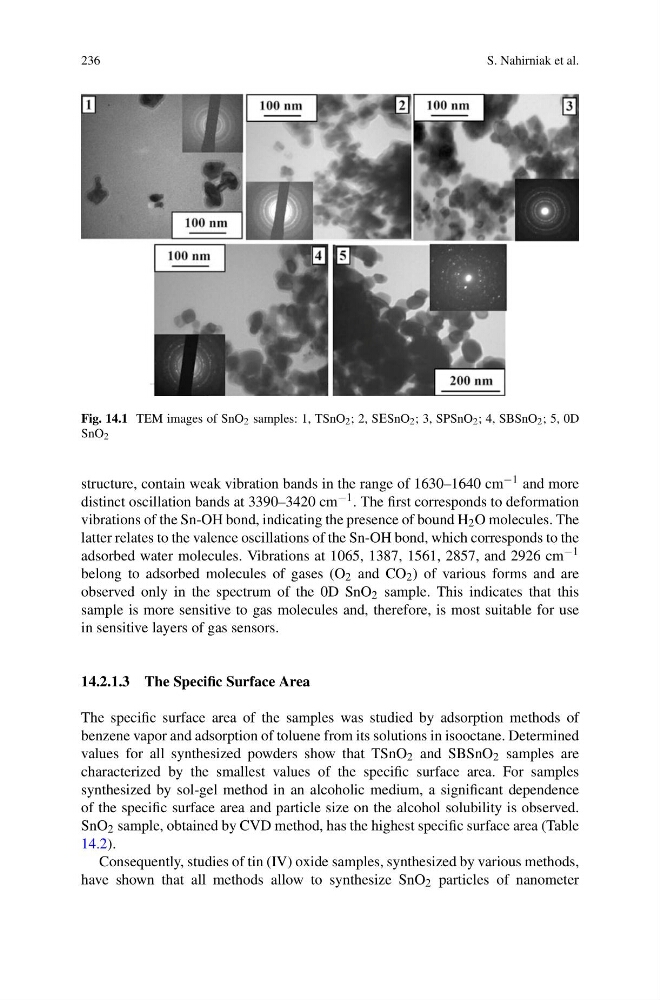
Fig. 14.1 TEM images of SnO 2 samples: 1, TSnO 2 ; 2, S¨SnO 2 ; 3, SPSnO 2 ; 4, SBSnO 2 ; 5, 0D
SnO 2
structure, contain weak vibration bands in the range of 1630–1640 cm −1 and more
distinct oscillation bands at 3390–3420 cm −1 . The first corresponds to deformation
vibrations of the Sn-OH bond, indicating the presence of bound H 2 O molecules. The
latter relates to the valence oscillations of the Sn-OH bond, which corresponds to the
adsorbed water molecules. Vibrations at 1065, 1387, 1561, 2857, and 2926 cm −1
belong to adsorbed molecules of gases (O 2 and CO 2 ) of various forms and are
observed only in the spectrum of the 0D SnO 2 sample. This indicates that this
sample is more sensitive to gas molecules and, therefore, is most suitable for use
in sensitive layers of gas sensors.
14.2.1.3 The Specific Surface Area
The specific surface area of the samples was studied by adsorption methods of
benzene vapor and adsorption of toluene from its solutions in isooctane. Determined
values for all synthesized powders show that TSnO 2 and SBSnO 2 samples are
characterized by the smallest values of the specific surface area. For samples
synthesized by sol-gel method in an alcoholic medium, a significant dependence
of the specific surface area and particle size on the alcohol solubility is observed.
SnO 2 sample, obtained by CVD method, has the highest specific surface area (Table
14.2).
Consequently, studies of tin (IV) oxide samples, synthesized by various methods,
have shown that all methods allow to synthesize SnO 2 particles of nanometer
S. Nahirniak et al.
Fig. 14.1 TEM images of SnO 2 samples: 1, TSnO 2 ; 2, S¨SnO 2 ; 3, SPSnO 2 ; 4, SBSnO 2 ; 5, 0D
SnO 2
structure, contain weak vibration bands in the range of 1630–1640 cm −1 and more
distinct oscillation bands at 3390–3420 cm −1 . The first corresponds to deformation
vibrations of the Sn-OH bond, indicating the presence of bound H 2 O molecules. The
latter relates to the valence oscillations of the Sn-OH bond, which corresponds to the
adsorbed water molecules. Vibrations at 1065, 1387, 1561, 2857, and 2926 cm −1
belong to adsorbed molecules of gases (O 2 and CO 2 ) of various forms and are
observed only in the spectrum of the 0D SnO 2 sample. This indicates that this
sample is more sensitive to gas molecules and, therefore, is most suitable for use
in sensitive layers of gas sensors.
14.2.1.3 The Specific Surface Area
The specific surface area of the samples was studied by adsorption methods of
benzene vapor and adsorption of toluene from its solutions in isooctane. Determined
values for all synthesized powders show that TSnO 2 and SBSnO 2 samples are
characterized by the smallest values of the specific surface area. For samples
synthesized by sol-gel method in an alcoholic medium, a significant dependence
of the specific surface area and particle size on the alcohol solubility is observed.
SnO 2 sample, obtained by CVD method, has the highest specific surface area (Table
14.2).
Consequently, studies of tin (IV) oxide samples, synthesized by various methods,
have shown that all methods allow to synthesize SnO 2 particles of nanometer