

172
V. Malyshev et al.
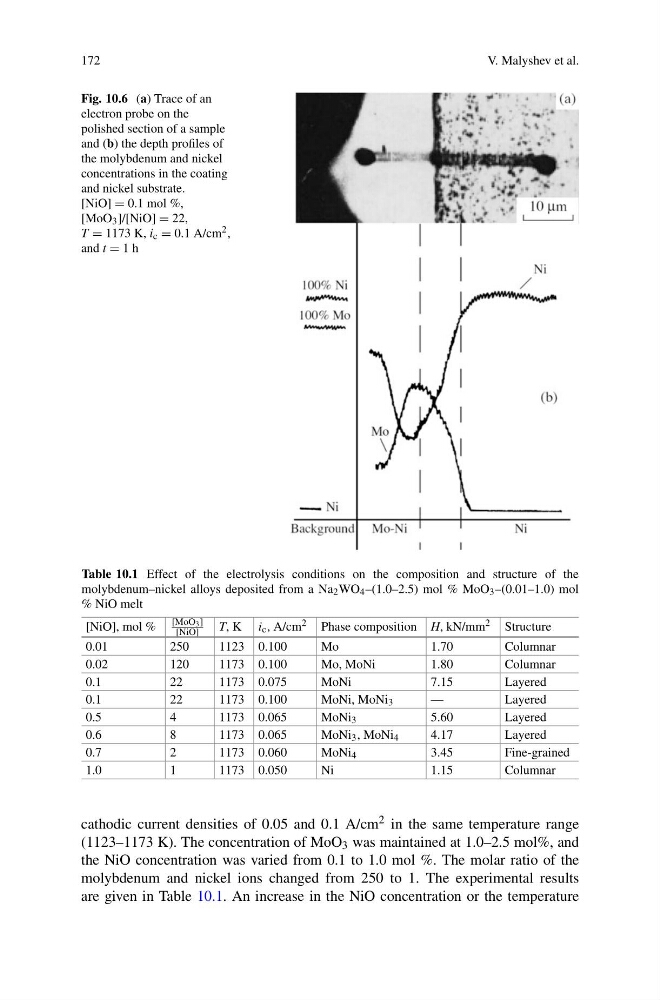
Fig. 10.6 (a) Trace of an
electron probe on the
polished section of a sample
and (b) the depth profiles of
the molybdenum and nickel
concentrations in the coating
and nickel substrate.
[NiO] = 0.1 mol %,
[MoO 3 ]/[NiO] = 22,
T = 1173 K, i c = 0.1 A/cm 2 ,
and t = 1 h
Table 10.1 Effect of the electrolysis conditions on the composition and structure of the
molybdenum–nickel alloys deposited from a Na 2 WO 4 –(1.0–2.5) mol % MoO 3 –(0.01–1.0) mol
% NiO melt
[NiO], mol %
[MoO 3 ]
[NiO]
T, K i c , A/cm 2 Phase composition H, kN/mm 2 Structure
0.01
250
1123 0.100
Mo
1.70
Columnar
0.02
120
1173 0.100
Mo, MoNi
1.80
Columnar
0.1
22
1173 0.075
MoNi
7.15
Layered
0.1
22
1173 0.100
MoNi, MoNi 3
—
Layered
0.5
4
1173 0.065
MoNi 3
5.60
Layered
0.6
8
1173 0.065
MoNi 3 , MoNi 4
4.17
Layered
0.7
2
1173 0.060
MoNi 4
3.45
Fine-grained
1.0
1
1173 0.050
Ni
1.15
Columnar
cathodic current densities of 0.05 and 0.1 A/cm 2 in the same temperature range
(1123–1173 K). The concentration of MoO 3 was maintained at 1.0–2.5 mol%, and
the NiO concentration was varied from 0.1 to 1.0 mol %. The molar ratio of the
molybdenum and nickel ions changed from 250 to 1. The experimental results
are given in Table 10.1. An increase in the NiO concentration or the temperature
V. Malyshev et al.
Fig. 10.6 (a) Trace of an
electron probe on the
polished section of a sample
and (b) the depth profiles of
the molybdenum and nickel
concentrations in the coating
and nickel substrate.
[NiO] = 0.1 mol %,
[MoO 3 ]/[NiO] = 22,
T = 1173 K, i c = 0.1 A/cm 2 ,
and t = 1 h
Table 10.1 Effect of the electrolysis conditions on the composition and structure of the
molybdenum–nickel alloys deposited from a Na 2 WO 4 –(1.0–2.5) mol % MoO 3 –(0.01–1.0) mol
% NiO melt
[NiO], mol %
[MoO 3 ]
[NiO]
T, K i c , A/cm 2 Phase composition H, kN/mm 2 Structure
0.01
250
1123 0.100
Mo
1.70
Columnar
0.02
120
1173 0.100
Mo, MoNi
1.80
Columnar
0.1
22
1173 0.075
MoNi
7.15
Layered
0.1
22
1173 0.100
MoNi, MoNi 3
—
Layered
0.5
4
1173 0.065
MoNi 3
5.60
Layered
0.6
8
1173 0.065
MoNi 3 , MoNi 4
4.17
Layered
0.7
2
1173 0.060
MoNi 4
3.45
Fine-grained
1.0
1
1173 0.050
Ni
1.15
Columnar
cathodic current densities of 0.05 and 0.1 A/cm 2 in the same temperature range
(1123–1173 K). The concentration of MoO 3 was maintained at 1.0–2.5 mol%, and
the NiO concentration was varied from 0.1 to 1.0 mol %. The molar ratio of the
molybdenum and nickel ions changed from 250 to 1. The experimental results
are given in Table 10.1. An increase in the NiO concentration or the temperature