

156
R. Kozakevych et al.
The Korsmeyer-Peppas kinetic model for drug release provides complementary
insight about the diffusion of Enoxil molecules within porous silica materials, in
particular whether diffusion occurs by Fickian or non-Fickian processes. Cumulative Enoxil release profiles associated with silica materials are fitted well by the
Korsmeyer-Peppas model, according to the R 2 values listed in Table 9.1.
The all-silica samples fitted better with the Korsmeyer-Peppas model that is
based on the power law, which establish an exponential correlation between drug
release and time. For the Korsmeyer-Peppas model, the value of release exponent
(n) correlated with mechanism that drives the drug release process and n release
exponent values of studied samples presented in Table 9.1 that characterize an
anomalous transport for this compositions.
9.3.4 Polymeric Composite Films
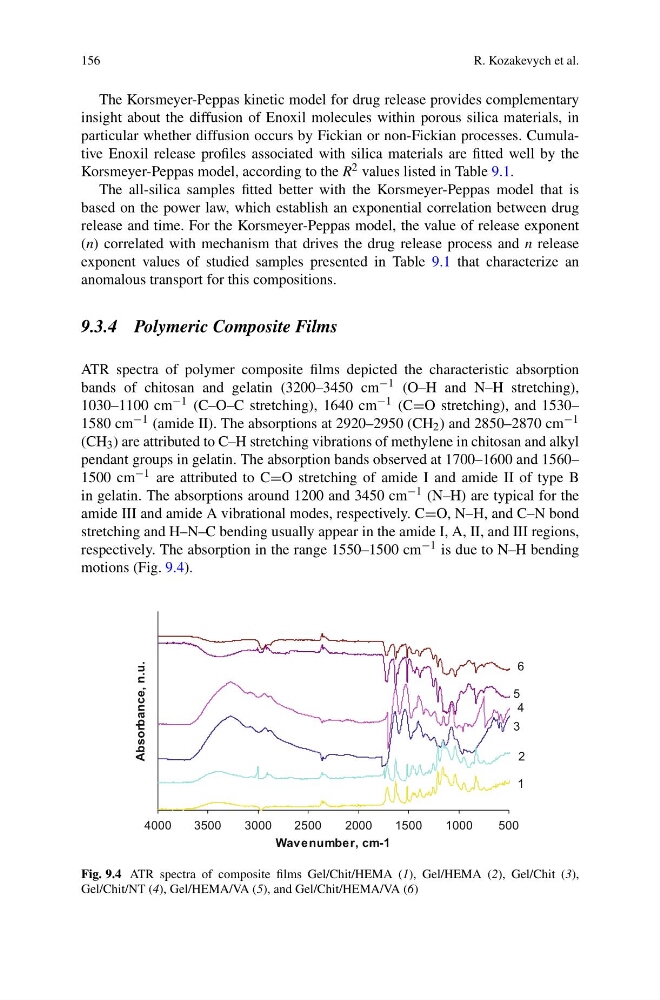
ATR spectra of polymer composite films depicted the characteristic absorption
bands of chitosan and gelatin (3200–3450 cm −1 (O–H and N–H stretching),
1030–1100 cm −1 (C–O–C stretching), 1640 cm −1 (C=O stretching), and 1530–
1580 cm −1 (amide II). The absorptions at 2920–2950 (CH 2 ) and 2850–2870 cm −1
(CH 3 ) are attributed to C–H stretching vibrations of methylene in chitosan and alkyl
pendant groups in gelatin. The absorption bands observed at 1700–1600 and 1560–
1500 cm −1 are attributed to C=O stretching of amide I and amide II of type B
in gelatin. The absorptions around 1200 and 3450 cm −1 (N–H) are typical for the
amide III and amide A vibrational modes, respectively. C=O, N–H, and C–N bond
stretching and H–N–C bending usually appear in the amide I, A, II, and III regions,
respectively. The absorption in the range 1550–1500 cm −1 is due to N–H bending
motions (Fig. 9.4).
500
1000
1500
2000
2500
3000
3500
4000
Wavenumber, cm-1
Absorbance, n.u.
1
2
3
4
5
6
Fig. 9.4 ATR spectra of composite films Gel/Chit/HEMA (1), Gel/HEMA (2), Gel/Chit (3),
Gel/Chit/NT (4), Gel/HEMA/VA (5), and Gel/Chit/HEMA/VA (6)
R. Kozakevych et al.
The Korsmeyer-Peppas kinetic model for drug release provides complementary
insight about the diffusion of Enoxil molecules within porous silica materials, in
particular whether diffusion occurs by Fickian or non-Fickian processes. Cumulative Enoxil release profiles associated with silica materials are fitted well by the
Korsmeyer-Peppas model, according to the R 2 values listed in Table 9.1.
The all-silica samples fitted better with the Korsmeyer-Peppas model that is
based on the power law, which establish an exponential correlation between drug
release and time. For the Korsmeyer-Peppas model, the value of release exponent
(n) correlated with mechanism that drives the drug release process and n release
exponent values of studied samples presented in Table 9.1 that characterize an
anomalous transport for this compositions.
9.3.4 Polymeric Composite Films
ATR spectra of polymer composite films depicted the characteristic absorption
bands of chitosan and gelatin (3200–3450 cm −1 (O–H and N–H stretching),
1030–1100 cm −1 (C–O–C stretching), 1640 cm −1 (C=O stretching), and 1530–
1580 cm −1 (amide II). The absorptions at 2920–2950 (CH 2 ) and 2850–2870 cm −1
(CH 3 ) are attributed to C–H stretching vibrations of methylene in chitosan and alkyl
pendant groups in gelatin. The absorption bands observed at 1700–1600 and 1560–
1500 cm −1 are attributed to C=O stretching of amide I and amide II of type B
in gelatin. The absorptions around 1200 and 3450 cm −1 (N–H) are typical for the
amide III and amide A vibrational modes, respectively. C=O, N–H, and C–N bond
stretching and H–N–C bending usually appear in the amide I, A, II, and III regions,
respectively. The absorption in the range 1550–1500 cm −1 is due to N–H bending
motions (Fig. 9.4).
500
1000
1500
2000
2500
3000
3500
4000
Wavenumber, cm-1
Absorbance, n.u.
1
2
3
4
5
6
Fig. 9.4 ATR spectra of composite films Gel/Chit/HEMA (1), Gel/HEMA (2), Gel/Chit (3),
Gel/Chit/NT (4), Gel/HEMA/VA (5), and Gel/Chit/HEMA/VA (6)