

140
L. V. Karabanova et al.
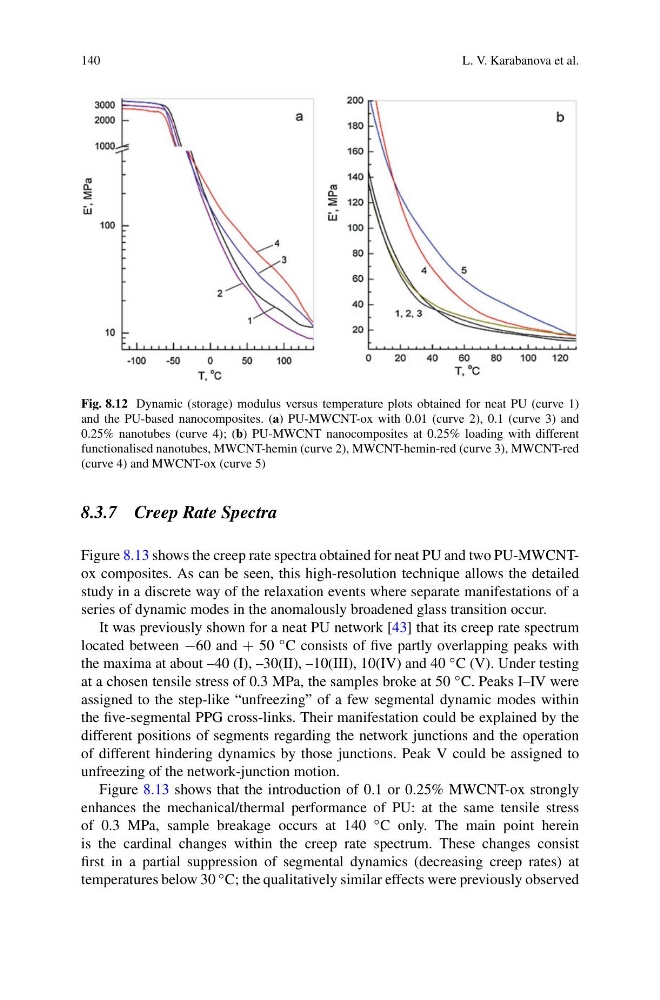
Fig. 8.12 Dynamic (storage) modulus versus temperature plots obtained for neat PU (curve 1)
and the PU-based nanocomposites. (a) PU-MWCNT-ox with 0.01 (curve 2), 0.1 (curve 3) and
0.25% nanotubes (curve 4); (b) PU-MWCNT nanocomposites at 0.25% loading with different
functionalised nanotubes, MWCNT-hemin (curve 2), MWCNT-hemin-red (curve 3), MWCNT-red
(curve 4) and MWCNT-ox (curve 5)
8.3.7 Creep Rate Spectra
Figure 8.13 shows the creep rate spectra obtained for neat PU and two PU-MWCNTox composites. As can be seen, this high-resolution technique allows the detailed
study in a discrete way of the relaxation events where separate manifestations of a
series of dynamic modes in the anomalously broadened glass transition occur.
It was previously shown for a neat PU network [43] that its creep rate spectrum
located between −60 and + 50 ◦ C consists of five partly overlapping peaks with
the maxima at about –40 (I), –30(II), –10(III), 10(IV) and 40 ◦ C (V). Under testing
at a chosen tensile stress of 0.3 MPa, the samples broke at 50 ◦ C. Peaks I–IV were
assigned to the step-like “unfreezing” of a few segmental dynamic modes within
the five-segmental PPG cross-links. Their manifestation could be explained by the
different positions of segments regarding the network junctions and the operation
of different hindering dynamics by those junctions. Peak V could be assigned to
unfreezing of the network-junction motion.
Figure 8.13 shows that the introduction of 0.1 or 0.25% MWCNT-ox strongly
enhances the mechanical/thermal performance of PU: at the same tensile stress
of 0.3 MPa, sample breakage occurs at 140 ◦ C only. The main point herein
is the cardinal changes within the creep rate spectrum. These changes consist
first in a partial suppression of segmental dynamics (decreasing creep rates) at
temperatures below 30 ◦ C; the qualitatively similar effects were previously observed
L. V. Karabanova et al.
Fig. 8.12 Dynamic (storage) modulus versus temperature plots obtained for neat PU (curve 1)
and the PU-based nanocomposites. (a) PU-MWCNT-ox with 0.01 (curve 2), 0.1 (curve 3) and
0.25% nanotubes (curve 4); (b) PU-MWCNT nanocomposites at 0.25% loading with different
functionalised nanotubes, MWCNT-hemin (curve 2), MWCNT-hemin-red (curve 3), MWCNT-red
(curve 4) and MWCNT-ox (curve 5)
8.3.7 Creep Rate Spectra
Figure 8.13 shows the creep rate spectra obtained for neat PU and two PU-MWCNTox composites. As can be seen, this high-resolution technique allows the detailed
study in a discrete way of the relaxation events where separate manifestations of a
series of dynamic modes in the anomalously broadened glass transition occur.
It was previously shown for a neat PU network [43] that its creep rate spectrum
located between −60 and + 50 ◦ C consists of five partly overlapping peaks with
the maxima at about –40 (I), –30(II), –10(III), 10(IV) and 40 ◦ C (V). Under testing
at a chosen tensile stress of 0.3 MPa, the samples broke at 50 ◦ C. Peaks I–IV were
assigned to the step-like “unfreezing” of a few segmental dynamic modes within
the five-segmental PPG cross-links. Their manifestation could be explained by the
different positions of segments regarding the network junctions and the operation
of different hindering dynamics by those junctions. Peak V could be assigned to
unfreezing of the network-junction motion.
Figure 8.13 shows that the introduction of 0.1 or 0.25% MWCNT-ox strongly
enhances the mechanical/thermal performance of PU: at the same tensile stress
of 0.3 MPa, sample breakage occurs at 140 ◦ C only. The main point herein
is the cardinal changes within the creep rate spectrum. These changes consist
first in a partial suppression of segmental dynamics (decreasing creep rates) at
temperatures below 30 ◦ C; the qualitatively similar effects were previously observed