

274
1
Nyquist Diagram
2 dB
0 dB
–2 dB
–4 dB
0.8
4 dB
–6 dB
0.6
6 dB
0.4 10 dB
–10 dB
0.2
Imaginary Axis
20 dB
–20 dB
0
–0.2
–0.4
–0.6
–0.8
–1
–1
–0.8
–0.6
–0.4
–0.2
0.2
0.4
0
0.6
0.8
1
Real Axis
Biologically Inspired Robotics
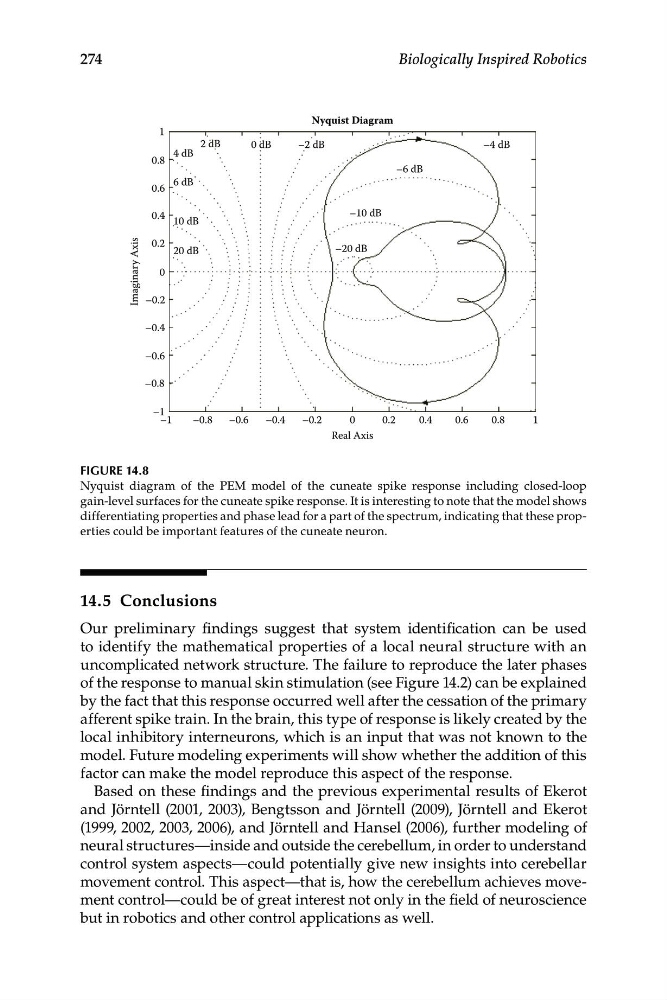
FIGURE 14.8
Nyquist diagram of the PEM model of the cuneate spike response including closed-loop
gain-level surfaces for the cuneate spike response. It is interesting to note that the model shows
differentiating properties and phase lead for a part of the spectrum, indicating that these properties could be important features of the cuneate neuron.
14.5 Conclusions
Our preliminary findings suggest that system identification can be used
to identify the mathematical properties of a local neural structure with an
uncomplicated network structure. The failure to reproduce the later phases
of the response to manual skin stimulation (see Figure 14.2) can be explained
by the fact that this response occurred well after the cessation of the primary
afferent spike train. In the brain, this type of response is likely created by the
local inhibitory interneurons, which is an input that was not known to the
model. Future modeling experiments will show whether the addition of this
factor can make the model reproduce this aspect of the response.
Based on these findings and the previous experimental results of Ekerot
and Jörntell (2001, 2003), Bengtsson and Jörntell (2009), Jörntell and Ekerot
(1999, 2002, 2003, 2006), and Jörntell and Hansel (2006), further modeling of
neural structures—inside and outside the cerebellum, in order to understand
control system aspects—could potentially give new insights into cerebellar
movement control. This aspect—that is, how the cerebellum achieves movement control—could be of great interest not only in the field of neuroscience
but in robotics and other control applications as well.
1
Nyquist Diagram
2 dB
0 dB
–2 dB
–4 dB
0.8
4 dB
–6 dB
0.6
6 dB
0.4 10 dB
–10 dB
0.2
Imaginary Axis
20 dB
–20 dB
0
–0.2
–0.4
–0.6
–0.8
–1
–1
–0.8
–0.6
–0.4
–0.2
0.2
0.4
0
0.6
0.8
1
Real Axis
Biologically Inspired Robotics
FIGURE 14.8
Nyquist diagram of the PEM model of the cuneate spike response including closed-loop
gain-level surfaces for the cuneate spike response. It is interesting to note that the model shows
differentiating properties and phase lead for a part of the spectrum, indicating that these properties could be important features of the cuneate neuron.
14.5 Conclusions
Our preliminary findings suggest that system identification can be used
to identify the mathematical properties of a local neural structure with an
uncomplicated network structure. The failure to reproduce the later phases
of the response to manual skin stimulation (see Figure 14.2) can be explained
by the fact that this response occurred well after the cessation of the primary
afferent spike train. In the brain, this type of response is likely created by the
local inhibitory interneurons, which is an input that was not known to the
model. Future modeling experiments will show whether the addition of this
factor can make the model reproduce this aspect of the response.
Based on these findings and the previous experimental results of Ekerot
and Jörntell (2001, 2003), Bengtsson and Jörntell (2009), Jörntell and Ekerot
(1999, 2002, 2003, 2006), and Jörntell and Hansel (2006), further modeling of
neural structures—inside and outside the cerebellum, in order to understand
control system aspects—could potentially give new insights into cerebellar
movement control. This aspect—that is, how the cerebellum achieves movement control—could be of great interest not only in the field of neuroscience
but in robotics and other control applications as well.