

269
Mathematical Modeling of Brain Circuitry
Histogram
–100
–50
–20
0
20
40
60
80
100
120
140
160
100
50
0
Spike Response
150
200
300
250
Time (ms)
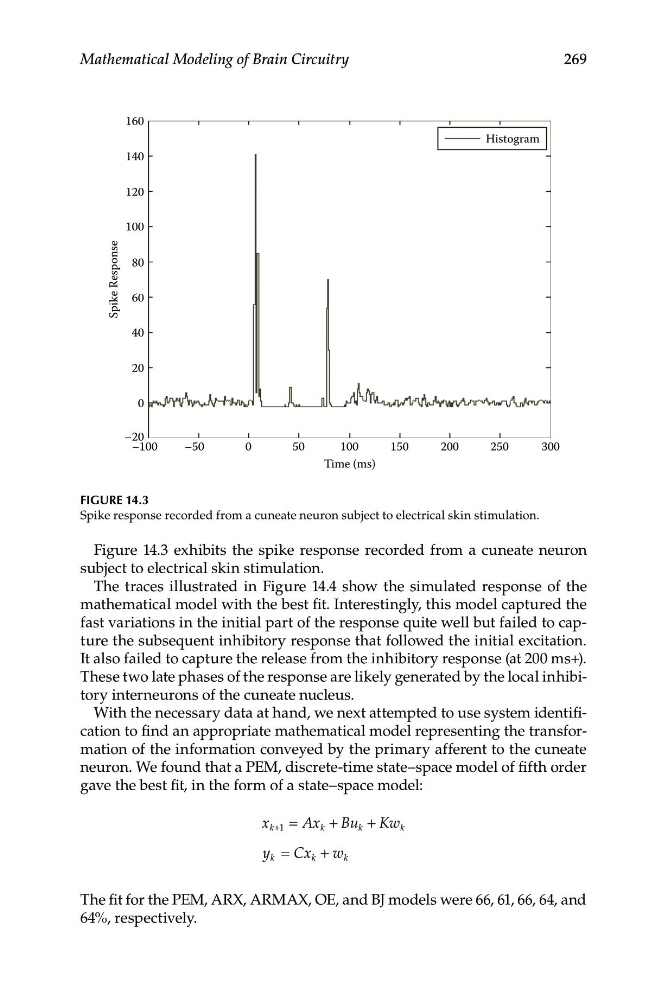
FIGURE 14.3
Spike response recorded from a cuneate neuron subject to electrical skin stimulation.
Figure 14.3 exhibits the spike response recorded from a cuneate neuron
subject to electrical skin stimulation.
The traces illustrated in Figure 14.4 show the simulated response of the
mathematical model with the best fit. Interestingly, this model captured the
fast variations in the initial part of the response quite well but failed to capture the subsequent inhibitory response that followed the initial excitation.
It also failed to capture the release from the inhibitory response (at 200 ms+).
These two late phases of the response are likely generated by the local inhibitory interneurons of the cuneate nucleus.
With the necessary data at hand, we next attempted to use system identification to find an appropriate mathematical model representing the transformation of the information conveyed by the primary afferent to the cuneate
neuron. We found that a PEM, discrete-time state–space model of fifth order
gave the best fit, in the form of a state–space model:
x = Ax + Bu + Kw
k+1
k
k
k
y k = Cx k + w k
The fit for the PEM, ARX, ARMAX, OE, and BJ models were 66, 61, 66, 64, and
64%, respectively.
Mathematical Modeling of Brain Circuitry
Histogram
–100
–50
–20
0
20
40
60
80
100
120
140
160
100
50
0
Spike Response
150
200
300
250
Time (ms)
FIGURE 14.3
Spike response recorded from a cuneate neuron subject to electrical skin stimulation.
Figure 14.3 exhibits the spike response recorded from a cuneate neuron
subject to electrical skin stimulation.
The traces illustrated in Figure 14.4 show the simulated response of the
mathematical model with the best fit. Interestingly, this model captured the
fast variations in the initial part of the response quite well but failed to capture the subsequent inhibitory response that followed the initial excitation.
It also failed to capture the release from the inhibitory response (at 200 ms+).
These two late phases of the response are likely generated by the local inhibitory interneurons of the cuneate nucleus.
With the necessary data at hand, we next attempted to use system identification to find an appropriate mathematical model representing the transformation of the information conveyed by the primary afferent to the cuneate
neuron. We found that a PEM, discrete-time state–space model of fifth order
gave the best fit, in the form of a state–space model:
x = Ax + Bu + Kw
k+1
k
k
k
y k = Cx k + w k
The fit for the PEM, ARX, ARMAX, OE, and BJ models were 66, 61, 66, 64, and
64%, respectively.