

159
a
b
Biomechanical Characterization of Human Red Blood Cells
a
b
c
d
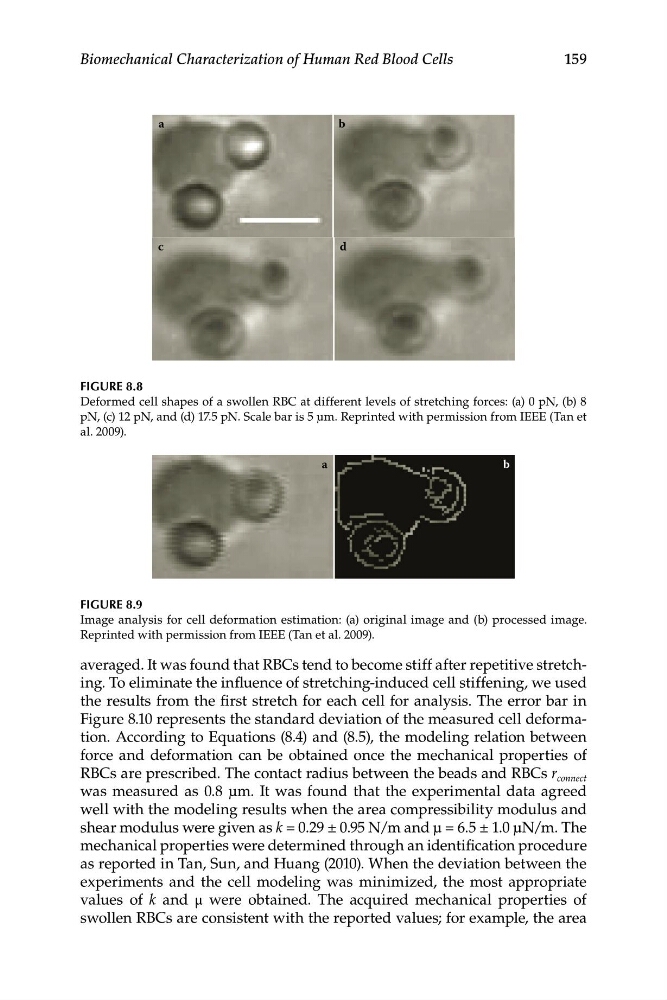
FIGURE 8.8
Deformed cell shapes of a swollen RBC at different levels of stretching forces: (a) 0 pN, (b) 8
pN, (c) 12 pN, and (d) 17.5 pN. Scale bar is 5 μm. Reprinted with permission from IEEE (Tan et
al. 2009).
FIGURE 8.9
Image analysis for cell deformation estimation: (a) original image and (b) processed image.
Reprinted with permission from IEEE (Tan et al. 2009).
averaged. It was found that RBCs tend to become stiff after repetitive stretching. To eliminate the influence of stretching-induced cell stiffening, we used
the results from the first stretch for each cell for analysis. The error bar in
Figure 8.10 represents the standard deviation of the measured cell deformation. According to Equations (8.4) and (8.5), the modeling relation between
force and deformation can be obtained once the mechanical properties of
RBCs are prescribed. The contact radius between the beads and RBCs r connect
was measured as 0.8 μm. It was found that the experimental data agreed
well with the modeling results when the area compressibility modulus and
shear modulus were given as k = 0.29 ± 0.95 N/m and μ = 6.5 ± 1.0 μN/m. The
mechanical properties were determined through an identification procedure
as reported in Tan, Sun, and Huang (2010). When the deviation between the
experiments and the cell modeling was minimized, the most appropriate
values of k and μ were obtained. The acquired mechanical properties of
swollen RBCs are consistent with the reported values; for example, the area
a
b
Biomechanical Characterization of Human Red Blood Cells
a
b
c
d
FIGURE 8.8
Deformed cell shapes of a swollen RBC at different levels of stretching forces: (a) 0 pN, (b) 8
pN, (c) 12 pN, and (d) 17.5 pN. Scale bar is 5 μm. Reprinted with permission from IEEE (Tan et
al. 2009).
FIGURE 8.9
Image analysis for cell deformation estimation: (a) original image and (b) processed image.
Reprinted with permission from IEEE (Tan et al. 2009).
averaged. It was found that RBCs tend to become stiff after repetitive stretching. To eliminate the influence of stretching-induced cell stiffening, we used
the results from the first stretch for each cell for analysis. The error bar in
Figure 8.10 represents the standard deviation of the measured cell deformation. According to Equations (8.4) and (8.5), the modeling relation between
force and deformation can be obtained once the mechanical properties of
RBCs are prescribed. The contact radius between the beads and RBCs r connect
was measured as 0.8 μm. It was found that the experimental data agreed
well with the modeling results when the area compressibility modulus and
shear modulus were given as k = 0.29 ± 0.95 N/m and μ = 6.5 ± 1.0 μN/m. The
mechanical properties were determined through an identification procedure
as reported in Tan, Sun, and Huang (2010). When the deviation between the
experiments and the cell modeling was minimized, the most appropriate
values of k and μ were obtained. The acquired mechanical properties of
swollen RBCs are consistent with the reported values; for example, the area