

4.5 Toward the Detection of Pathogenic Bacteria on PNHSMA Films
83
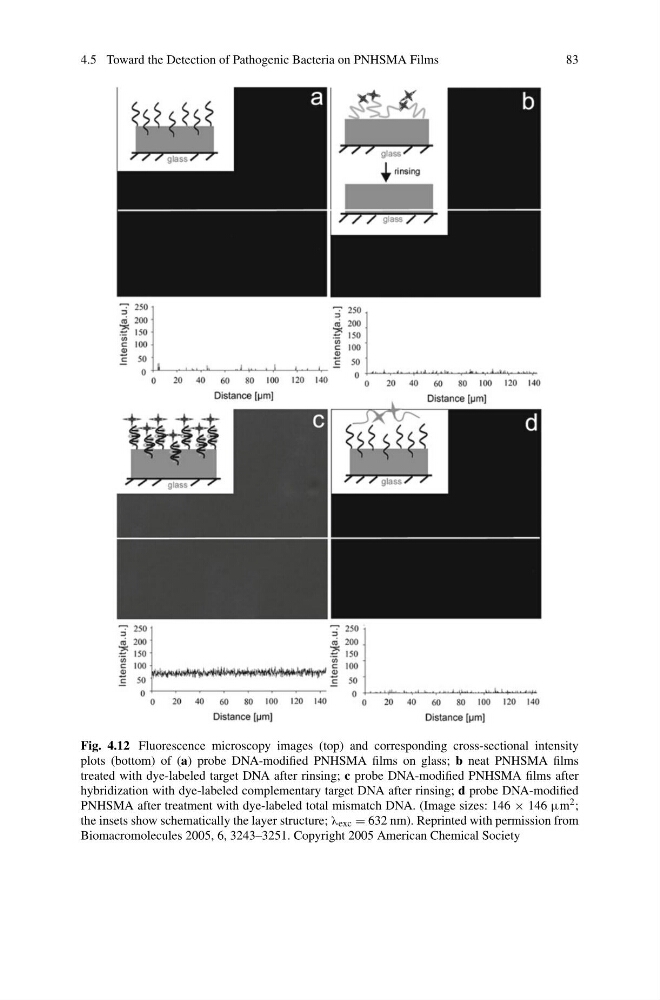
Fig. 4.12 Fluorescence microscopy images (top) and corresponding cross-sectional intensity
plots (bottom) of (a) probe DNA-modified PNHSMA films on glass; b neat PNHSMA films
treated with dye-labeled target DNA after rinsing; c probe DNA-modified PNHSMA films after
hybridization with dye-labeled complementary target DNA after rinsing; d probe DNA-modified
PNHSMA after treatment with dye-labeled total mismatch DNA. (Image sizes: 146 × 146 μm 2 ;
the insets show schematically the layer structure; λ exc = 632 nm). Reprinted with permission from
Biomacromolecules 2005, 6, 3243–3251. Copyright 2005 American Chemical Society
83
Fig. 4.12 Fluorescence microscopy images (top) and corresponding cross-sectional intensity
plots (bottom) of (a) probe DNA-modified PNHSMA films on glass; b neat PNHSMA films
treated with dye-labeled target DNA after rinsing; c probe DNA-modified PNHSMA films after
hybridization with dye-labeled complementary target DNA after rinsing; d probe DNA-modified
PNHSMA after treatment with dye-labeled total mismatch DNA. (Image sizes: 146 × 146 μm 2 ;
the insets show schematically the layer structure; λ exc = 632 nm). Reprinted with permission from
Biomacromolecules 2005, 6, 3243–3251. Copyright 2005 American Chemical Society