

6.3 Functionalization of PNHSMA Films by Reactive μCP
113
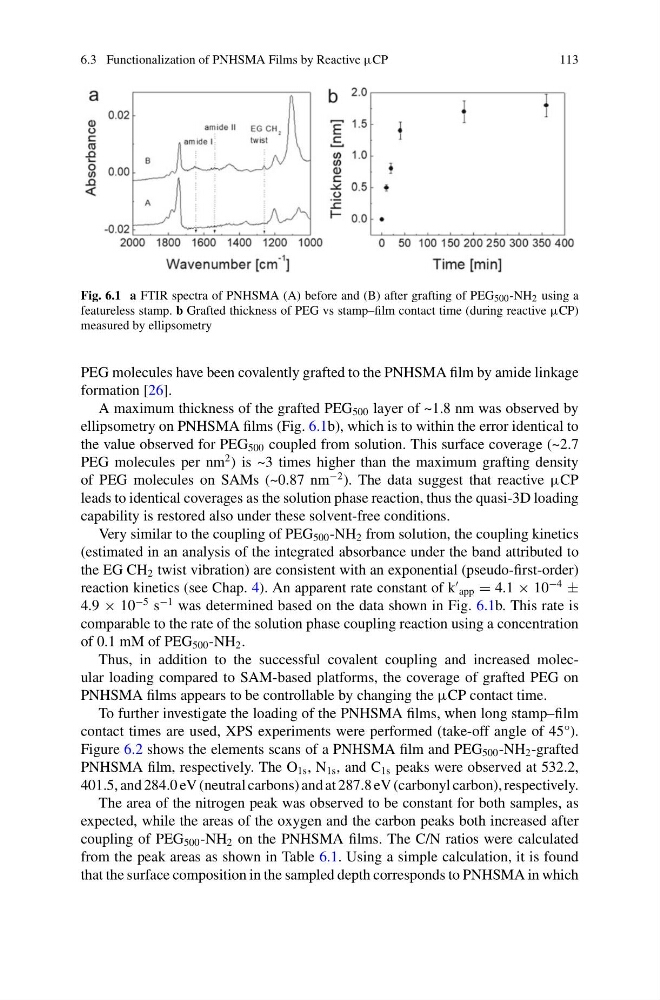
Fig. 6.1 a FTIR spectra of PNHSMA (A) before and (B) after grafting of PEG 500 -NH 2 using a
featureless stamp. b Grafted thickness of PEG vs stamp–film contact time (during reactive μCP)
measured by ellipsometry
PEG molecules have been covalently grafted to the PNHSMA film by amide linkage
formation [26].
A maximum thickness of the grafted PEG 500 layer of ~1.8 nm was observed by
ellipsometry on PNHSMA films (Fig. 6.1b), which is to within the error identical to
the value observed for PEG 500 coupled from solution. This surface coverage (~2.7
PEG molecules per nm
2 ) is ~3 times higher than the maximum grafting density
of PEG molecules on SAMs (~0.87 nm
−2 ). The data suggest that reactive μCP
leads to identical coverages as the solution phase reaction, thus the quasi-3D loading
capability is restored also under these solvent-free conditions.
Very similar to the coupling of PEG 500 -NH 2 from solution, the coupling kinetics
(estimated in an analysis of the integrated absorbance under the band attributed to
the EG CH 2 twist vibration) are consistent with an exponential (pseudo-first-order)
reaction kinetics (see Chap. 4). An apparent rate constant of k
app = 4.1 × 10
−4
±
4.9 × 10
−5 s
−1 was determined based on the data shown in Fig. 6.1b. This rate is
comparable to the rate of the solution phase coupling reaction using a concentration
of 0.1 mM of PEG 500 -NH 2 .
Thus, in addition to the successful covalent coupling and increased molecular loading compared to SAM-based platforms, the coverage of grafted PEG on
PNHSMA films appears to be controllable by changing the μCP contact time.
To further investigate the loading of the PNHSMA films, when long stamp–film
contact times are used, XPS experiments were performed (take-off angle of 45°).
Figure 6.2 shows the elements scans of a PNHSMA film and PEG 500 -NH 2 -grafted
PNHSMA film, respectively. The O 1s , N 1s , and C 1s peaks were observed at 532.2,
401.5, and 284.0 eV (neutral carbons) and at 287.8 eV (carbonyl carbon), respectively.
The area of the nitrogen peak was observed to be constant for both samples, as
expected, while the areas of the oxygen and the carbon peaks both increased after
coupling of PEG 500 -NH 2 on the PNHSMA films. The C/N ratios were calculated
from the peak areas as shown in Table 6.1. Using a simple calculation, it is found
that the surface composition in the sampled depth corresponds to PNHSMA in which
113
Fig. 6.1 a FTIR spectra of PNHSMA (A) before and (B) after grafting of PEG 500 -NH 2 using a
featureless stamp. b Grafted thickness of PEG vs stamp–film contact time (during reactive μCP)
measured by ellipsometry
PEG molecules have been covalently grafted to the PNHSMA film by amide linkage
formation [26].
A maximum thickness of the grafted PEG 500 layer of ~1.8 nm was observed by
ellipsometry on PNHSMA films (Fig. 6.1b), which is to within the error identical to
the value observed for PEG 500 coupled from solution. This surface coverage (~2.7
PEG molecules per nm
2 ) is ~3 times higher than the maximum grafting density
of PEG molecules on SAMs (~0.87 nm
−2 ). The data suggest that reactive μCP
leads to identical coverages as the solution phase reaction, thus the quasi-3D loading
capability is restored also under these solvent-free conditions.
Very similar to the coupling of PEG 500 -NH 2 from solution, the coupling kinetics
(estimated in an analysis of the integrated absorbance under the band attributed to
the EG CH 2 twist vibration) are consistent with an exponential (pseudo-first-order)
reaction kinetics (see Chap. 4). An apparent rate constant of k
app = 4.1 × 10
−4
±
4.9 × 10
−5 s
−1 was determined based on the data shown in Fig. 6.1b. This rate is
comparable to the rate of the solution phase coupling reaction using a concentration
of 0.1 mM of PEG 500 -NH 2 .
Thus, in addition to the successful covalent coupling and increased molecular loading compared to SAM-based platforms, the coverage of grafted PEG on
PNHSMA films appears to be controllable by changing the μCP contact time.
To further investigate the loading of the PNHSMA films, when long stamp–film
contact times are used, XPS experiments were performed (take-off angle of 45°).
Figure 6.2 shows the elements scans of a PNHSMA film and PEG 500 -NH 2 -grafted
PNHSMA film, respectively. The O 1s , N 1s , and C 1s peaks were observed at 532.2,
401.5, and 284.0 eV (neutral carbons) and at 287.8 eV (carbonyl carbon), respectively.
The area of the nitrogen peak was observed to be constant for both samples, as
expected, while the areas of the oxygen and the carbon peaks both increased after
coupling of PEG 500 -NH 2 on the PNHSMA films. The C/N ratios were calculated
from the peak areas as shown in Table 6.1. Using a simple calculation, it is found
that the surface composition in the sampled depth corresponds to PNHSMA in which