

36
S. Mandal and S. Biswas
4 Results and Discussions
4.1 SCS-CN Method Outcome
4.1.1 Computation of Weighted Curve Number
Hydrologic soil group map and land use map have been integrated to account for
spatial variability of a soil group and land use type. A General curve number (CNII) is assigned for each hydrologic soil group under the AMC-II conditions, which
correspond to each land use area. The soil-land use layer is then overlaid with the
previously created Thiessen polygon layer of the catchment, where each Thiessen
polygon represents the influence area of each rain gauge station. The curve number
for the whole catchment has been computed as 76. The weighted curve number has
been calculated for each Thiessen cell, which varies from 54 to 85.
4.1.2 Computation of Runoff
Daily rainfall values for 16 years (2000–2015), as mentioned in Sect. 2, have been
utilized for runoff estimation for the catchment. Daily runoff values have been
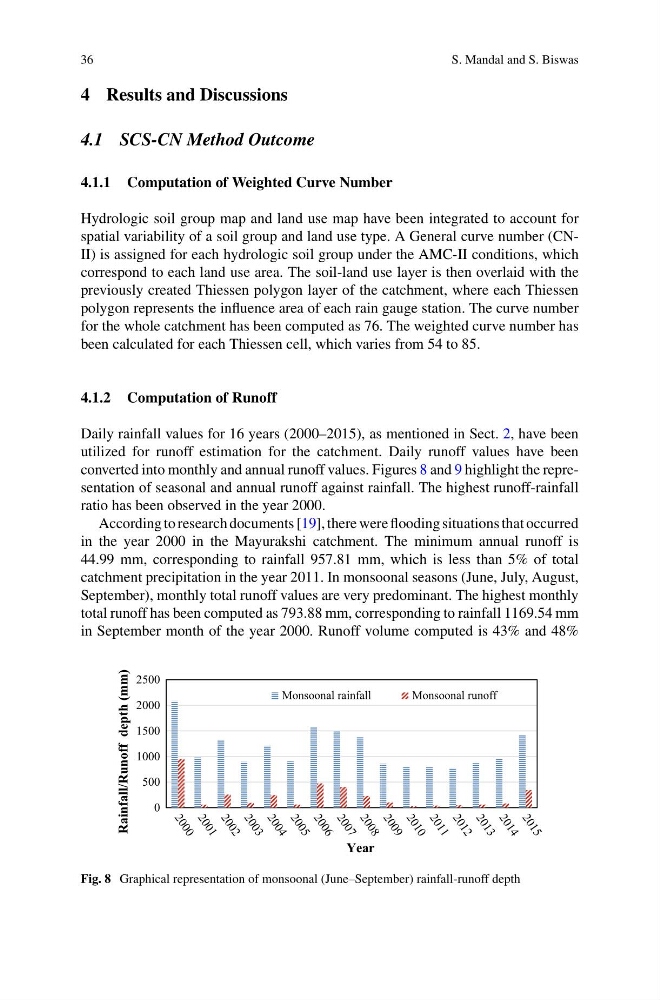
converted into monthly and annual runoff values. Figures 8 and 9 highlight the representation of seasonal and annual runoff against rainfall. The highest runoff-rainfall
ratio has been observed in the year 2000.
According to research documents [19], there were flooding situations that occurred
in the year 2000 in the Mayurakshi catchment. The minimum annual runoff is
44.99 mm, corresponding to rainfall 957.81 mm, which is less than 5% of total
catchment precipitation in the year 2011. In monsoonal seasons (June, July, August,
September), monthly total runoff values are very predominant. The highest monthly
total runoff has been computed as 793.88 mm, corresponding to rainfall 1169.54 mm
in September month of the year 2000. Runoff volume computed is 43% and 48%
0
500
1000
1500
2000
2500
Rainfall/Runoff depth (mm)
Year
Monsoonal rainfall
Monsoonal runoff
Fig. 8 Graphical representation of monsoonal (June–September) rainfall-runoff depth
S. Mandal and S. Biswas
4 Results and Discussions
4.1 SCS-CN Method Outcome
4.1.1 Computation of Weighted Curve Number
Hydrologic soil group map and land use map have been integrated to account for
spatial variability of a soil group and land use type. A General curve number (CNII) is assigned for each hydrologic soil group under the AMC-II conditions, which
correspond to each land use area. The soil-land use layer is then overlaid with the
previously created Thiessen polygon layer of the catchment, where each Thiessen
polygon represents the influence area of each rain gauge station. The curve number
for the whole catchment has been computed as 76. The weighted curve number has
been calculated for each Thiessen cell, which varies from 54 to 85.
4.1.2 Computation of Runoff
Daily rainfall values for 16 years (2000–2015), as mentioned in Sect. 2, have been
utilized for runoff estimation for the catchment. Daily runoff values have been
converted into monthly and annual runoff values. Figures 8 and 9 highlight the representation of seasonal and annual runoff against rainfall. The highest runoff-rainfall
ratio has been observed in the year 2000.
According to research documents [19], there were flooding situations that occurred
in the year 2000 in the Mayurakshi catchment. The minimum annual runoff is
44.99 mm, corresponding to rainfall 957.81 mm, which is less than 5% of total
catchment precipitation in the year 2011. In monsoonal seasons (June, July, August,
September), monthly total runoff values are very predominant. The highest monthly
total runoff has been computed as 793.88 mm, corresponding to rainfall 1169.54 mm
in September month of the year 2000. Runoff volume computed is 43% and 48%
0
500
1000
1500
2000
2500
Rainfall/Runoff depth (mm)
Year
Monsoonal rainfall
Monsoonal runoff
Fig. 8 Graphical representation of monsoonal (June–September) rainfall-runoff depth