

22
S. P. Kayastha and K. Pradhanang
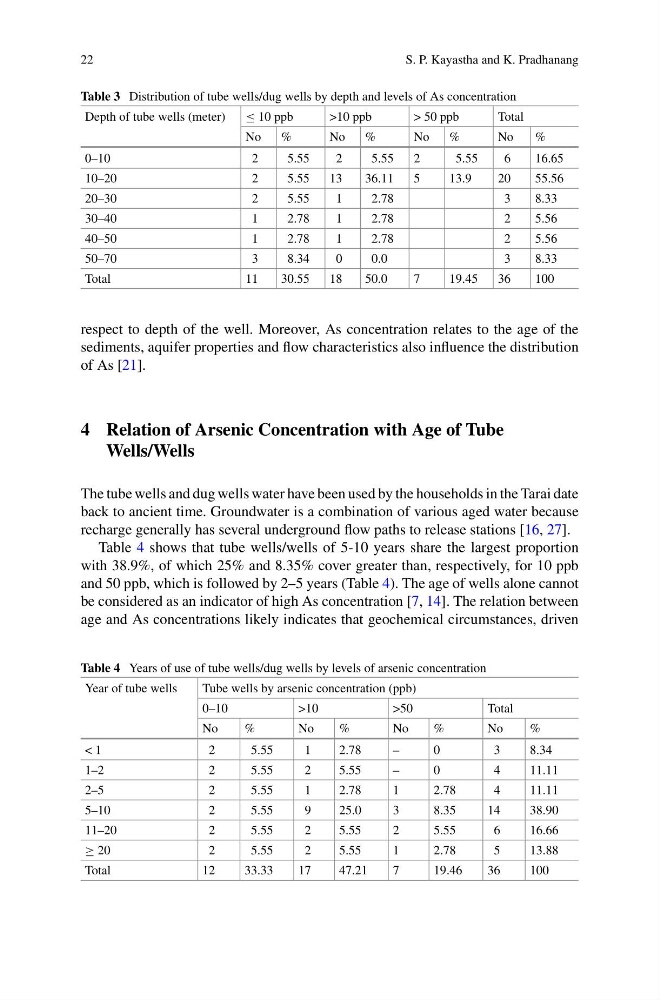
Table 3 Distribution of tube wells/dug wells by depth and levels of As concentration
Depth of tube wells (meter)
≤ 10 ppb
>10 ppb
> 50 ppb
Total
No
%
No
%
No
%
No
%
0–10
2
5.55
2
5.55
2
5.55
6
16.65
10–20
2
5.55
13
36.11
5
13.9
20
55.56
20–30
2
5.55
1
2.78
3
8.33
30–40
1
2.78
1
2.78
2
5.56
40–50
1
2.78
1
2.78
2
5.56
50–70
3
8.34
0
0.0
3
8.33
Total
11
30.55
18
50.0
7
19.45
36
100
respect to depth of the well. Moreover, As concentration relates to the age of the
sediments, aquifer properties and flow characteristics also influence the distribution
of As [21].
4 Relation of Arsenic Concentration with Age of Tube
Wells/Wells
The tube wells and dug wells water have been used by the households in the Tarai date
back to ancient time. Groundwater is a combination of various aged water because
recharge generally has several underground flow paths to release stations [16, 27].
Table 4 shows that tube wells/wells of 5-10 years share the largest proportion
with 38.9%, of which 25% and 8.35% cover greater than, respectively, for 10 ppb
and 50 ppb, which is followed by 2–5 years (Table 4). The age of wells alone cannot
be considered as an indicator of high As concentration [7, 14]. The relation between
age and As concentrations likely indicates that geochemical circumstances, driven
Table 4 Years of use of tube wells/dug wells by levels of arsenic concentration
Year of tube wells
Tube wells by arsenic concentration (ppb)
0–10
>10
>50
Total
No
%
No
%
No
%
No
%
< 1
2
5.55
1
2.78
–
0
3
8.34
1–2
2
5.55
2
5.55
–
0
4
11.11
2–5
2
5.55
1
2.78
1
2.78
4
11.11
5–10
2
5.55
9
25.0
3
8.35
14
38.90
11–20
2
5.55
2
5.55
2
5.55
6
16.66
≥ 20
2
5.55
2
5.55
1
2.78
5
13.88
Total
12
33.33
17
47.21
7
19.46
36
100
S. P. Kayastha and K. Pradhanang
Table 3 Distribution of tube wells/dug wells by depth and levels of As concentration
Depth of tube wells (meter)
≤ 10 ppb
>10 ppb
> 50 ppb
Total
No
%
No
%
No
%
No
%
0–10
2
5.55
2
5.55
2
5.55
6
16.65
10–20
2
5.55
13
36.11
5
13.9
20
55.56
20–30
2
5.55
1
2.78
3
8.33
30–40
1
2.78
1
2.78
2
5.56
40–50
1
2.78
1
2.78
2
5.56
50–70
3
8.34
0
0.0
3
8.33
Total
11
30.55
18
50.0
7
19.45
36
100
respect to depth of the well. Moreover, As concentration relates to the age of the
sediments, aquifer properties and flow characteristics also influence the distribution
of As [21].
4 Relation of Arsenic Concentration with Age of Tube
Wells/Wells
The tube wells and dug wells water have been used by the households in the Tarai date
back to ancient time. Groundwater is a combination of various aged water because
recharge generally has several underground flow paths to release stations [16, 27].
Table 4 shows that tube wells/wells of 5-10 years share the largest proportion
with 38.9%, of which 25% and 8.35% cover greater than, respectively, for 10 ppb
and 50 ppb, which is followed by 2–5 years (Table 4). The age of wells alone cannot
be considered as an indicator of high As concentration [7, 14]. The relation between
age and As concentrations likely indicates that geochemical circumstances, driven
Table 4 Years of use of tube wells/dug wells by levels of arsenic concentration
Year of tube wells
Tube wells by arsenic concentration (ppb)
0–10
>10
>50
Total
No
%
No
%
No
%
No
%
< 1
2
5.55
1
2.78
–
0
3
8.34
1–2
2
5.55
2
5.55
–
0
4
11.11
2–5
2
5.55
1
2.78
1
2.78
4
11.11
5–10
2
5.55
9
25.0
3
8.35
14
38.90
11–20
2
5.55
2
5.55
2
5.55
6
16.66
≥ 20
2
5.55
2
5.55
1
2.78
5
13.88
Total
12
33.33
17
47.21
7
19.46
36
100