

220
R. L. Sahu et al.
0.01
0.1
1
10
0
20
40
60
80
100
Percentage Finner
Sieve Size in mm
Finner
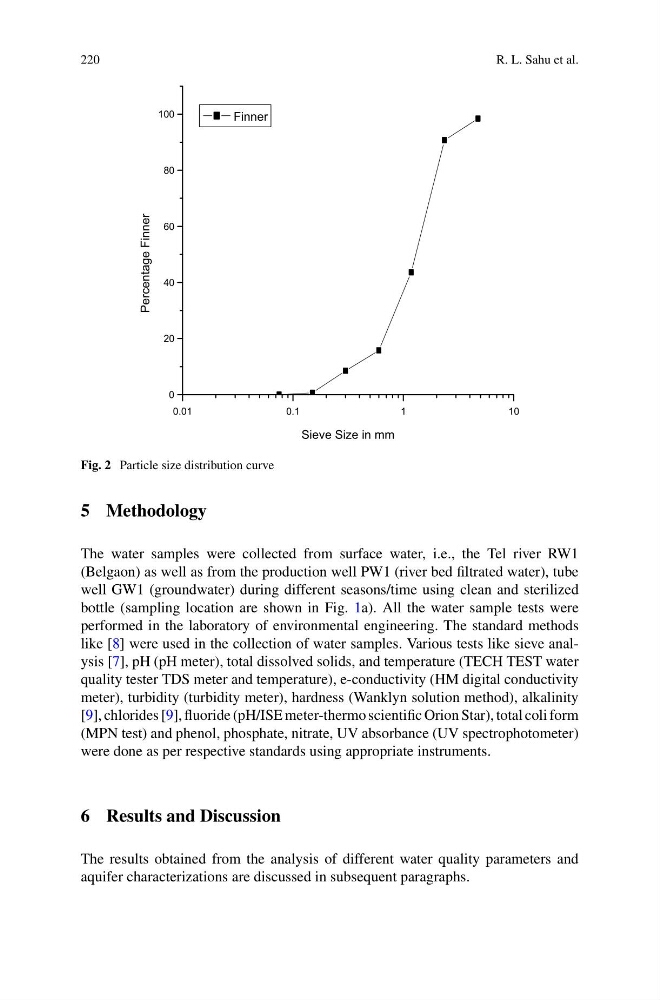
Fig. 2 Particle size distribution curve
5 Methodology
The water samples were collected from surface water, i.e., the Tel river RW1
(Belgaon) as well as from the production well PW1 (river bed filtrated water), tube
well GW1 (groundwater) during different seasons/time using clean and sterilized
bottle (sampling location are shown in Fig. 1a). All the water sample tests were
performed in the laboratory of environmental engineering. The standard methods
like [8] were used in the collection of water samples. Various tests like sieve analysis [7], pH (pH meter), total dissolved solids, and temperature (TECH TEST water
quality tester TDS meter and temperature), e-conductivity (HM digital conductivity
meter), turbidity (turbidity meter), hardness (Wanklyn solution method), alkalinity
[9], chlorides [9], fluoride (pH/ISE meter-thermo scientific Orion Star), total coli form
(MPN test) and phenol, phosphate, nitrate, UV absorbance (UV spectrophotometer)
were done as per respective standards using appropriate instruments.
6 Results and Discussion
The results obtained from the analysis of different water quality parameters and
aquifer characterizations are discussed in subsequent paragraphs.
R. L. Sahu et al.
0.01
0.1
1
10
0
20
40
60
80
100
Percentage Finner
Sieve Size in mm
Finner
Fig. 2 Particle size distribution curve
5 Methodology
The water samples were collected from surface water, i.e., the Tel river RW1
(Belgaon) as well as from the production well PW1 (river bed filtrated water), tube
well GW1 (groundwater) during different seasons/time using clean and sterilized
bottle (sampling location are shown in Fig. 1a). All the water sample tests were
performed in the laboratory of environmental engineering. The standard methods
like [8] were used in the collection of water samples. Various tests like sieve analysis [7], pH (pH meter), total dissolved solids, and temperature (TECH TEST water
quality tester TDS meter and temperature), e-conductivity (HM digital conductivity
meter), turbidity (turbidity meter), hardness (Wanklyn solution method), alkalinity
[9], chlorides [9], fluoride (pH/ISE meter-thermo scientific Orion Star), total coli form
(MPN test) and phenol, phosphate, nitrate, UV absorbance (UV spectrophotometer)
were done as per respective standards using appropriate instruments.
6 Results and Discussion
The results obtained from the analysis of different water quality parameters and
aquifer characterizations are discussed in subsequent paragraphs.