

212
S. T. Kalathil et al.
3.1 Effect of Submerged Vanes on Local Scour Depth Ratio
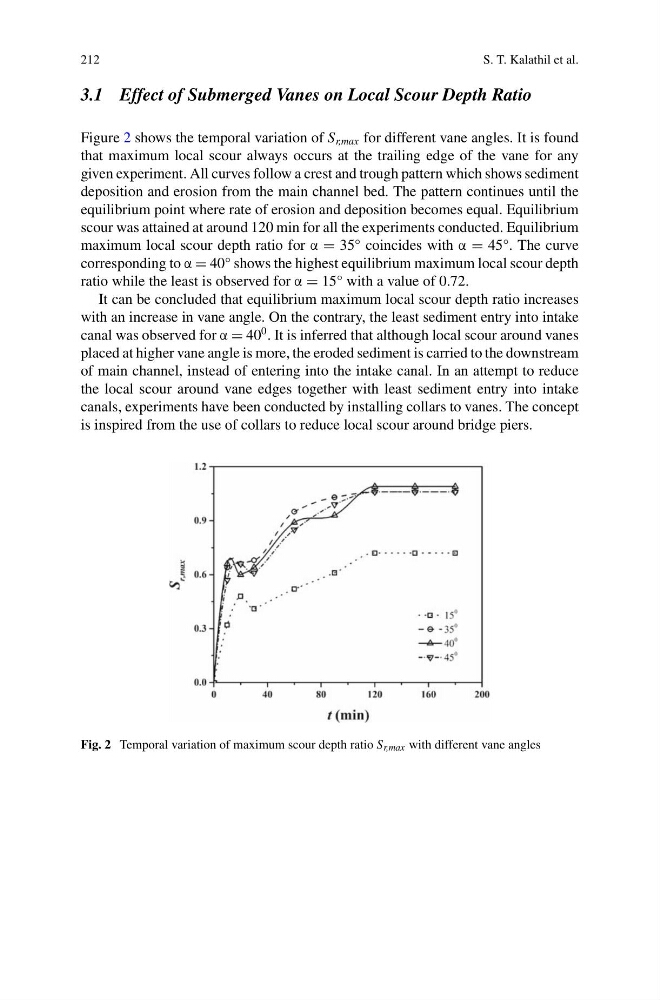
Figure 2 shows the temporal variation of S r,max for different vane angles. It is found
that maximum local scour always occurs at the trailing edge of the vane for any
given experiment. All curves follow a crest and trough pattern which shows sediment
deposition and erosion from the main channel bed. The pattern continues until the
equilibrium point where rate of erosion and deposition becomes equal. Equilibrium
scour was attained at around 120 min for all the experiments conducted. Equilibrium
maximum local scour depth ratio for α = 35° coincides with α = 45°. The curve
corresponding to α = 40° shows the highest equilibrium maximum local scour depth
ratio while the least is observed for α = 15° with a value of 0.72.
It can be concluded that equilibrium maximum local scour depth ratio increases
with an increase in vane angle. On the contrary, the least sediment entry into intake
canal was observed for α = 40
0 . It is inferred that although local scour around vanes
placed at higher vane angle is more, the eroded sediment is carried to the downstream
of main channel, instead of entering into the intake canal. In an attempt to reduce
the local scour around vane edges together with least sediment entry into intake
canals, experiments have been conducted by installing collars to vanes. The concept
is inspired from the use of collars to reduce local scour around bridge piers.
Fig. 2 Temporal variation of maximum scour depth ratio S r,max with different vane angles
S. T. Kalathil et al.
3.1 Effect of Submerged Vanes on Local Scour Depth Ratio
Figure 2 shows the temporal variation of S r,max for different vane angles. It is found
that maximum local scour always occurs at the trailing edge of the vane for any
given experiment. All curves follow a crest and trough pattern which shows sediment
deposition and erosion from the main channel bed. The pattern continues until the
equilibrium point where rate of erosion and deposition becomes equal. Equilibrium
scour was attained at around 120 min for all the experiments conducted. Equilibrium
maximum local scour depth ratio for α = 35° coincides with α = 45°. The curve
corresponding to α = 40° shows the highest equilibrium maximum local scour depth
ratio while the least is observed for α = 15° with a value of 0.72.
It can be concluded that equilibrium maximum local scour depth ratio increases
with an increase in vane angle. On the contrary, the least sediment entry into intake
canal was observed for α = 40
0 . It is inferred that although local scour around vanes
placed at higher vane angle is more, the eroded sediment is carried to the downstream
of main channel, instead of entering into the intake canal. In an attempt to reduce
the local scour around vane edges together with least sediment entry into intake
canals, experiments have been conducted by installing collars to vanes. The concept
is inspired from the use of collars to reduce local scour around bridge piers.
Fig. 2 Temporal variation of maximum scour depth ratio S r,max with different vane angles