

Predicting Meander Migration of the Barak River by Empirical …
117
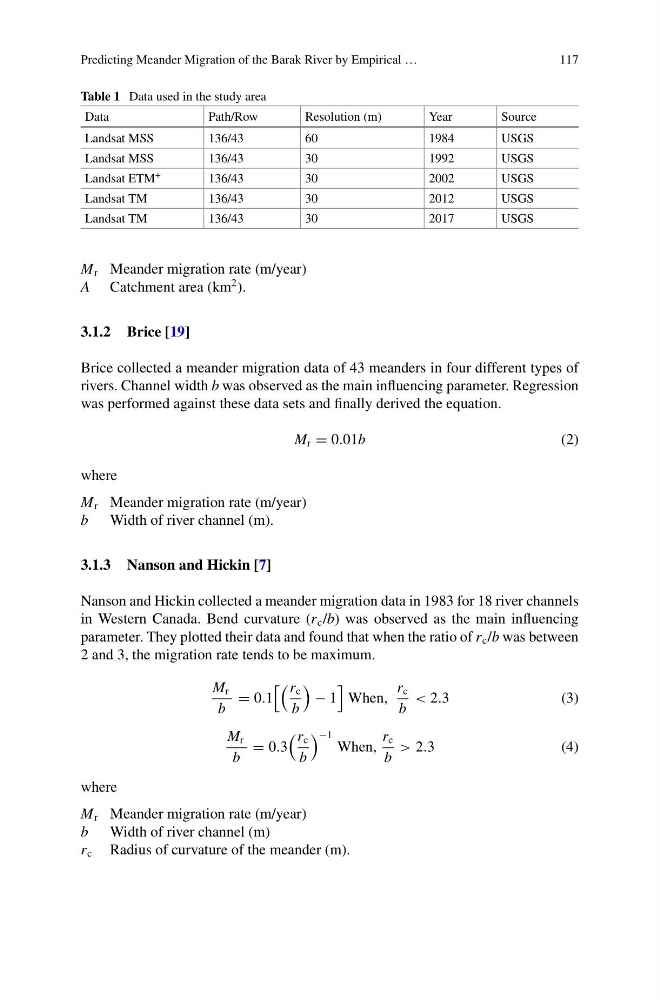
Table 1 Data used in the study area
Data
Path/Row
Resolution (m)
Year
Source
Landsat MSS
136/43
60
1984
USGS
Landsat MSS
136/43
30
1992
USGS
Landsat ETM +
136/43
30
2002
USGS
Landsat TM
136/43
30
2012
USGS
Landsat TM
136/43
30
2017
USGS
M r Meander migration rate (m/year)
A Catchment area (km
2 ).
3.1.2 Brice [19]
Brice collected a meander migration data of 43 meanders in four different types of
rivers. Channel width b was observed as the main influencing parameter. Regression
was performed against these data sets and finally derived the equation.
M r = 0.01b
(2)
where
M r Meander migration rate (m/year)
b Width of river channel (m).
3.1.3 Nanson and Hickin [7]
Nanson and Hickin collected a meander migration data in 1983 for 18 river channels
in Western Canada. Bend curvature (r c /b) was observed as the main influencing
parameter. They plotted their data and found that when the ratio of r c /b was between
2 and 3, the migration rate tends to be maximum.
M r
b
= 0.1
r c
b
− 1
When,
r c
b
< 2.3
( 3 )
M r
b
= 0.3
r c
b
−1
When,
r c
b
> 2.3
( 4 )
where
M r Meander migration rate (m/year)
b Width of river channel (m)
r c Radius of curvature of the meander (m).
117
Table 1 Data used in the study area
Data
Path/Row
Resolution (m)
Year
Source
Landsat MSS
136/43
60
1984
USGS
Landsat MSS
136/43
30
1992
USGS
Landsat ETM +
136/43
30
2002
USGS
Landsat TM
136/43
30
2012
USGS
Landsat TM
136/43
30
2017
USGS
M r Meander migration rate (m/year)
A Catchment area (km
2 ).
3.1.2 Brice [19]
Brice collected a meander migration data of 43 meanders in four different types of
rivers. Channel width b was observed as the main influencing parameter. Regression
was performed against these data sets and finally derived the equation.
M r = 0.01b
(2)
where
M r Meander migration rate (m/year)
b Width of river channel (m).
3.1.3 Nanson and Hickin [7]
Nanson and Hickin collected a meander migration data in 1983 for 18 river channels
in Western Canada. Bend curvature (r c /b) was observed as the main influencing
parameter. They plotted their data and found that when the ratio of r c /b was between
2 and 3, the migration rate tends to be maximum.
M r
b
= 0.1
r c
b
− 1
When,
r c
b
< 2.3
( 3 )
M r
b
= 0.3
r c
b
−1
When,
r c
b
> 2.3
( 4 )
where
M r Meander migration rate (m/year)
b Width of river channel (m)
r c Radius of curvature of the meander (m).