

Water Pipeline Routing …
105
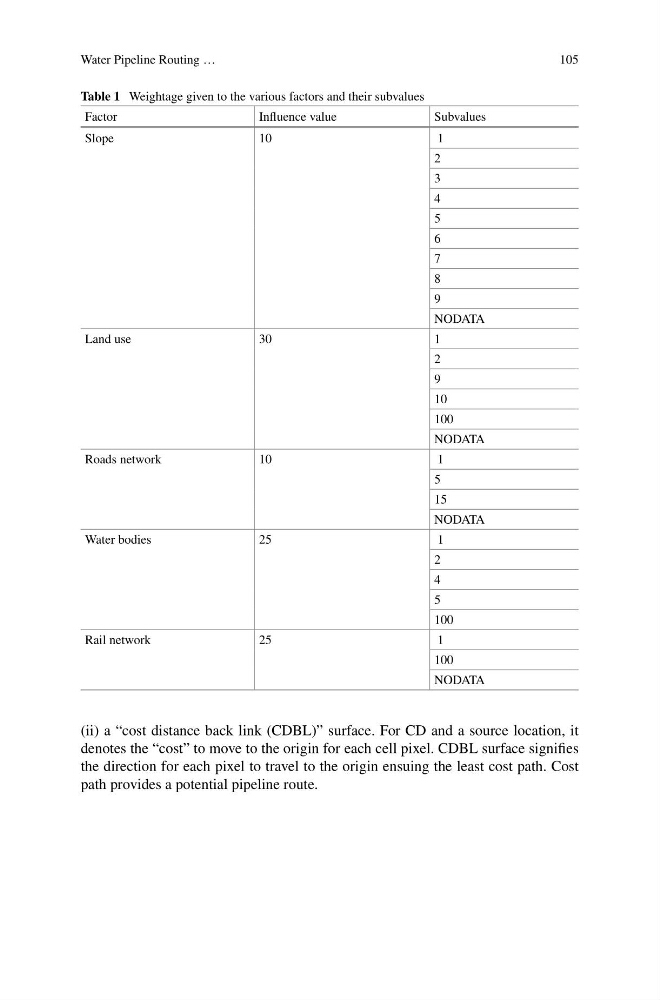
Table 1 Weightage given to the various factors and their subvalues
Factor
Influence value
Subvalues
Slope
10
1
2
3
4
5
6
7
8
9
NODATA
Land use
30
1
2
9
10
100
NODATA
Roads network
10
1
5
15
NODATA
Water bodies
25
1
2
4
5
100
Rail network
25
1
100
NODATA
(ii) a “cost distance back link (CDBL)” surface. For CD and a source location, it
denotes the “cost” to move to the origin for each cell pixel. CDBL surface signifies
the direction for each pixel to travel to the origin ensuing the least cost path. Cost
path provides a potential pipeline route.
105
Table 1 Weightage given to the various factors and their subvalues
Factor
Influence value
Subvalues
Slope
10
1
2
3
4
5
6
7
8
9
NODATA
Land use
30
1
2
9
10
100
NODATA
Roads network
10
1
5
15
NODATA
Water bodies
25
1
2
4
5
100
Rail network
25
1
100
NODATA
(ii) a “cost distance back link (CDBL)” surface. For CD and a source location, it
denotes the “cost” to move to the origin for each cell pixel. CDBL surface signifies
the direction for each pixel to travel to the origin ensuing the least cost path. Cost
path provides a potential pipeline route.