

88
P. K. Das et al.
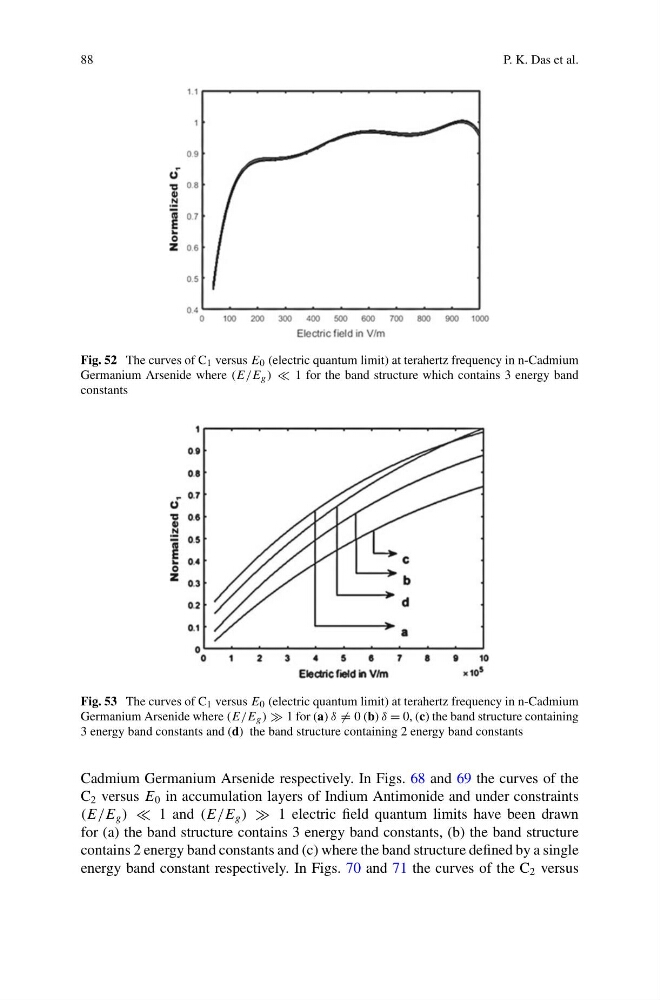
Fig. 52 The curves of C 1 versus E 0 (electric quantum limit) at terahertz frequency in n-Cadmium
Germanium Arsenide where (E/E g ) 1 for the band structure which contains 3 energy band
constants
Fig. 53 The curves of C 1 versus E 0 (electric quantum limit) at terahertz frequency in n-Cadmium
Germanium Arsenide where (E/E g ) 1 for (a) δ = 0 (b) δ = 0, (c) the band structure containing
3 energy band constants and (d) the band structure containing 2 energy band constants
Cadmium Germanium Arsenide respectively. In Figs. 68 and 69 the curves of the
C 2 versus E 0 in accumulation layers of Indium Antimonide and under constraints
(E/E g ) 1 and (E/E g ) 1 electric field quantum limits have been drawn
for (a) the band structure contains 3 energy band constants, (b) the band structure
contains 2 energy band constants and (c) where the band structure defined by a single
energy band constant respectively. In Figs. 70 and 71 the curves of the C 2 versus
P. K. Das et al.
Fig. 52 The curves of C 1 versus E 0 (electric quantum limit) at terahertz frequency in n-Cadmium
Germanium Arsenide where (E/E g ) 1 for the band structure which contains 3 energy band
constants
Fig. 53 The curves of C 1 versus E 0 (electric quantum limit) at terahertz frequency in n-Cadmium
Germanium Arsenide where (E/E g ) 1 for (a) δ = 0 (b) δ = 0, (c) the band structure containing
3 energy band constants and (d) the band structure containing 2 energy band constants
Cadmium Germanium Arsenide respectively. In Figs. 68 and 69 the curves of the
C 2 versus E 0 in accumulation layers of Indium Antimonide and under constraints
(E/E g ) 1 and (E/E g ) 1 electric field quantum limits have been drawn
for (a) the band structure contains 3 energy band constants, (b) the band structure
contains 2 energy band constants and (c) where the band structure defined by a single
energy band constant respectively. In Figs. 70 and 71 the curves of the C 2 versus