

TOAD-Based Frequency-Encoded All Optical …
185
1540
1545
1550
1555
1560
1565
1570
0
0.1
0.2
0.3
0.4
0.5
0.6
0.7
0.8
0.9
1
Wavelength(nm)
Power(a.u.)
Power spectrum of Input and output
Input A= u1
Input B=u1
Output u1
1540
1545
1550
1555
1560
1565
1570
0
0.1
0.2
0.3
0.4
0.5
0.6
0.7
0.8
0.9
1
Wavelength(nm)
Power(a.u.)
Power spectrum of Input and output
Input A=u1
Input B=u2
Output u2
a
b
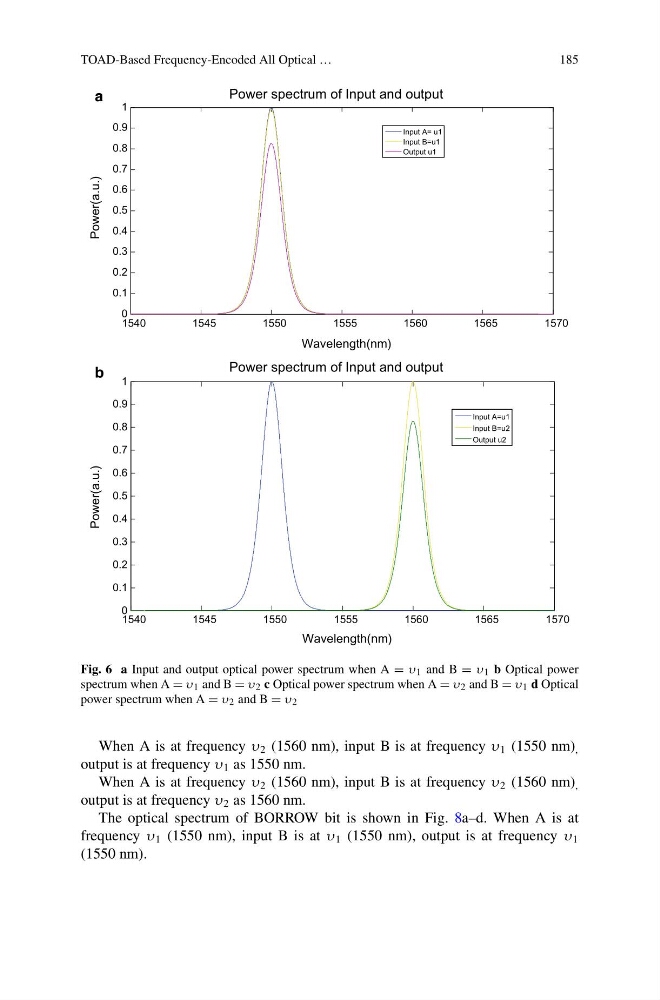
Fig. 6 a Input and output optical power spectrum when A = υ 1 and B = υ 1 b Optical power
spectrum when A = υ 1 and B = υ 2 c Optical power spectrum when A = υ 2 and B = υ 1 d Optical
power spectrum when A = υ 2 and B = υ 2
When A is at frequency υ 2 (1560 nm), input B is at frequency υ 1 (1550 nm) ,
output is at frequency υ 1 as 1550 nm.
When A is at frequency υ 2 (1560 nm), input B is at frequency υ 2 (1560 nm) ,
output is at frequency υ 2 as 1560 nm.
The optical spectrum of BORROW bit is shown in Fig. 8a–d. When A is at
frequency υ 1 (1550 nm), input B is at υ 1 (1550 nm), output is at frequency υ 1
(1550 nm).
185
1540
1545
1550
1555
1560
1565
1570
0
0.1
0.2
0.3
0.4
0.5
0.6
0.7
0.8
0.9
1
Wavelength(nm)
Power(a.u.)
Power spectrum of Input and output
Input A= u1
Input B=u1
Output u1
1540
1545
1550
1555
1560
1565
1570
0
0.1
0.2
0.3
0.4
0.5
0.6
0.7
0.8
0.9
1
Wavelength(nm)
Power(a.u.)
Power spectrum of Input and output
Input A=u1
Input B=u2
Output u2
a
b
Fig. 6 a Input and output optical power spectrum when A = υ 1 and B = υ 1 b Optical power
spectrum when A = υ 1 and B = υ 2 c Optical power spectrum when A = υ 2 and B = υ 1 d Optical
power spectrum when A = υ 2 and B = υ 2
When A is at frequency υ 2 (1560 nm), input B is at frequency υ 1 (1550 nm) ,
output is at frequency υ 1 as 1550 nm.
When A is at frequency υ 2 (1560 nm), input B is at frequency υ 2 (1560 nm) ,
output is at frequency υ 2 as 1560 nm.
The optical spectrum of BORROW bit is shown in Fig. 8a–d. When A is at
frequency υ 1 (1550 nm), input B is at υ 1 (1550 nm), output is at frequency υ 1
(1550 nm).