

184
K. Mukherjee et al.
Table 2 Truth table of the frequency-encoded half subtractor
Input
Output (Y )
A
B
DIFFERENCE = A ⊕ B
BORROW = AB
υ 1 (0)
υ 1 (0)
υ 1 (0)
υ 1 (0)
υ 1 (0)
υ 2 (1)
υ 2 (1)
υ 2 (1)
υ 2 (1)
υ 1 (0)
υ 2 (1)
υ 1 (0)
υ 2 (1)
υ 2 (1)
υ 1 (0)
υ 1 (0)
7 Simulation and Result
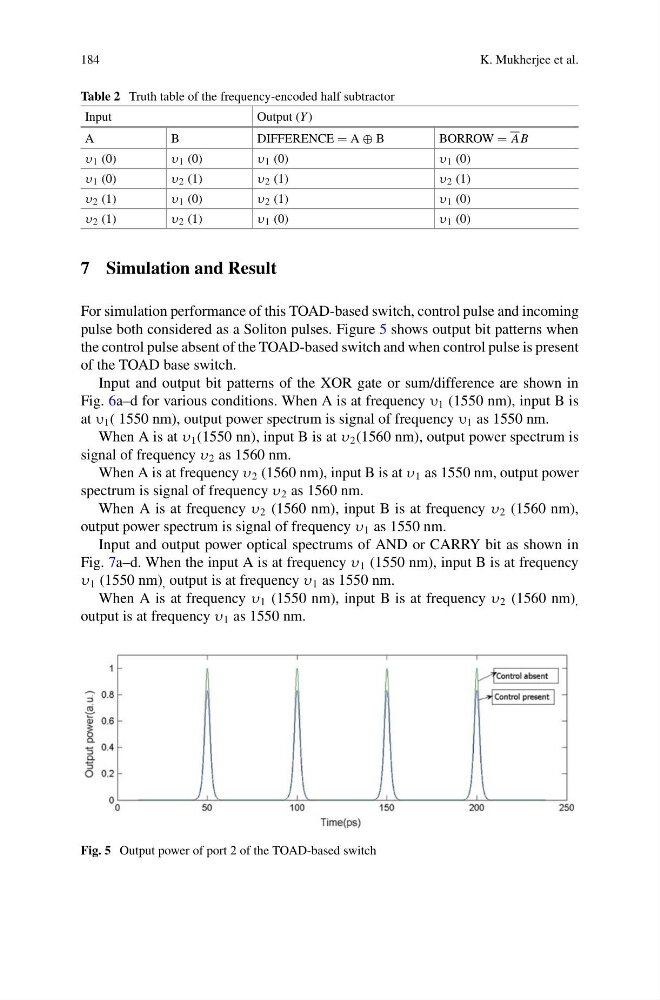
For simulation performance of this TOAD-based switch, control pulse and incoming
pulse both considered as a Soliton pulses. Figure 5 shows output bit patterns when
the control pulse absent of the TOAD-based switch and when control pulse is present
of the TOAD base switch.
Input and output bit patterns of the XOR gate or sum/difference are shown in
Fig. 6a–d for various conditions. When A is at frequency υ 1 (1550 nm), input B is
at υ 1 ( 1550 nm), output power spectrum is signal of frequency υ 1 as 1550 nm.
When A is at υ 1 (1550 nn), input B is at υ 2 (1560 nm), output power spectrum is
signal of frequency υ 2 as 1560 nm.
When A is at frequency υ 2 (1560 nm), input B is at υ 1 as 1550 nm, output power
spectrum is signal of frequency υ 2 as 1560 nm.
When A is at frequency υ 2 (1560 nm), input B is at frequency υ 2 (1560 nm),
output power spectrum is signal of frequency υ 1 as 1550 nm.
Input and output power optical spectrums of AND or CARRY bit as shown in
Fig. 7a–d. When the input A is at frequency υ 1 (1550 nm), input B is at frequency
υ 1 (1550 nm) , output is at frequency υ 1 as 1550 nm.
When A is at frequency υ 1 (1550 nm), input B is at frequency υ 2 (1560 nm) ,
output is at frequency υ 1 as 1550 nm.
Fig. 5 Output power of port 2 of the TOAD-based switch
K. Mukherjee et al.
Table 2 Truth table of the frequency-encoded half subtractor
Input
Output (Y )
A
B
DIFFERENCE = A ⊕ B
BORROW = AB
υ 1 (0)
υ 1 (0)
υ 1 (0)
υ 1 (0)
υ 1 (0)
υ 2 (1)
υ 2 (1)
υ 2 (1)
υ 2 (1)
υ 1 (0)
υ 2 (1)
υ 1 (0)
υ 2 (1)
υ 2 (1)
υ 1 (0)
υ 1 (0)
7 Simulation and Result
For simulation performance of this TOAD-based switch, control pulse and incoming
pulse both considered as a Soliton pulses. Figure 5 shows output bit patterns when
the control pulse absent of the TOAD-based switch and when control pulse is present
of the TOAD base switch.
Input and output bit patterns of the XOR gate or sum/difference are shown in
Fig. 6a–d for various conditions. When A is at frequency υ 1 (1550 nm), input B is
at υ 1 ( 1550 nm), output power spectrum is signal of frequency υ 1 as 1550 nm.
When A is at υ 1 (1550 nn), input B is at υ 2 (1560 nm), output power spectrum is
signal of frequency υ 2 as 1560 nm.
When A is at frequency υ 2 (1560 nm), input B is at υ 1 as 1550 nm, output power
spectrum is signal of frequency υ 2 as 1560 nm.
When A is at frequency υ 2 (1560 nm), input B is at frequency υ 2 (1560 nm),
output power spectrum is signal of frequency υ 1 as 1550 nm.
Input and output power optical spectrums of AND or CARRY bit as shown in
Fig. 7a–d. When the input A is at frequency υ 1 (1550 nm), input B is at frequency
υ 1 (1550 nm) , output is at frequency υ 1 as 1550 nm.
When A is at frequency υ 1 (1550 nm), input B is at frequency υ 2 (1560 nm) ,
output is at frequency υ 1 as 1550 nm.
Fig. 5 Output power of port 2 of the TOAD-based switch