

All Optical Universal Logic TAND Gate Using a Single …
169
Case 3: When A = 1 and B = 0’, only pump signal is present and the output
Q of the QDSOA becomes high and output P becomes low (as no probe signal
is present there), i.e., P = 1 and Q = 0.
Case 4: When both the inputs A and B becomes ‘1’ both pump & probe signals are
present and the output Q of the QDSOA becomes low and output P is high, i.e.,
P = 1 and Q = 0.
3 Modeling and Results of Simulations
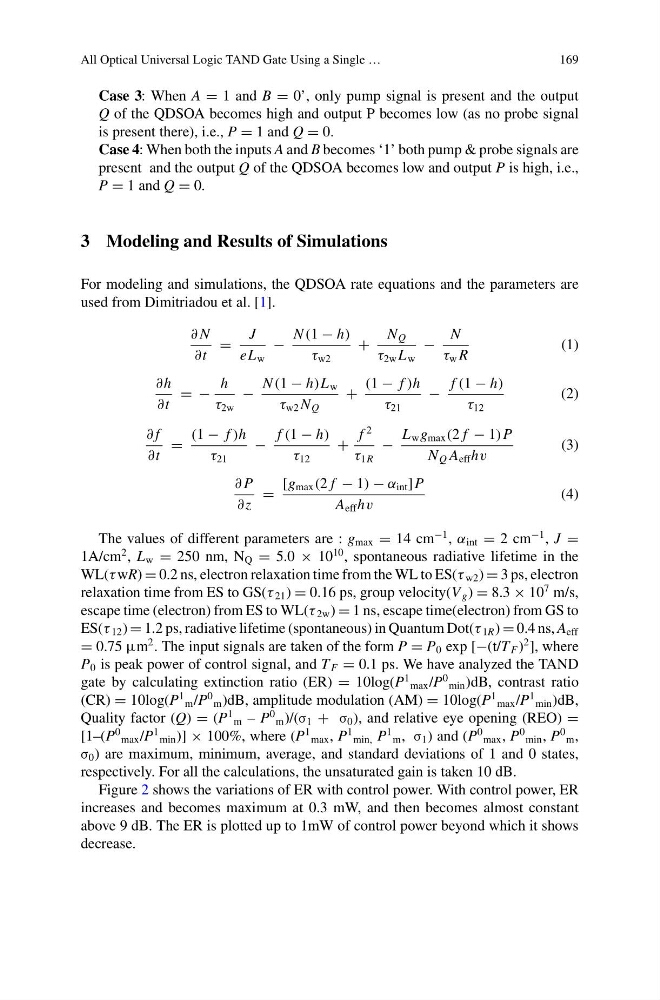
For modeling and simulations, the QDSOA rate equations and the parameters are
used from Dimitriadou et al. [1].
∂ N
∂t
=
J
eL w
−
N (1 − h)
τ w2
+
N Q
τ 2w L w
−
N
τ w R
(1)
∂h
∂t
= −
h
τ 2w
−
N (1 − h)L w
τ w2 N Q
+
(1 − f )h
τ 21
−
f (1 − h)
τ 12
(2)
∂ f
∂t
=
(1 − f )h
τ 21
−
f (1 − h)
τ 12
+
f
2
τ 1R
−
L w g max (2 f − 1)P
N Q A eff hv
(3)
∂ P
∂z
=
[g max (2 f − 1) − α int ]P
A eff hv
(4)
The values of different parameters are : g max = 14 cm
−1 , α int = 2 cm
−1 , J =
1A/cm
2 , L w = 250 nm, N Q = 5.0 × 10
10 , spontaneous radiative lifetime in the
WL(τ wR) = 0.2 ns, electron relaxation time from the WL to ES(τ w2 ) = 3 ps, electron
relaxation time from ES to GS(τ 21 ) = 0.16 ps, group velocity(V g ) = 8.3 × 10
7 m/s,
escape time (electron) from ES to WL(τ 2w ) = 1 ns, escape time(electron) from GS to
ES(τ 12 ) = 1.2 ps, radiative lifetime (spontaneous) in Quantum Dot(τ 1R ) = 0.4 ns, A eff
= 0.75 μm
2 . The input signals are taken of the form P = P 0 exp [−(t/T F )
2 ], where
P 0 is peak power of control signal, and T F = 0.1 ps. We have analyzed the TAND
gate by calculating extinction ratio (ER) = 10log(P
1
max /P
0
min )dB, contrast ratio
(CR) = 10log(P
1
m /P
0
m )dB, amplitude modulation (AM) = 10log(P
1
max /P
1
min )dB,
Quality factor (Q) = (P
1
m – P
0
m )/(σ 1 + σ 0 ), and relative eye opening (REO) =
[1–(P
0
max /P
1
min )] × 100%, where (P
1
max , P
1
min, P
1
m , σ 1 ) and (P
0
max , P
0
min , P
0
m ,
σ 0 ) are maximum, minimum, average, and standard deviations of 1 and 0 states,
respectively. For all the calculations, the unsaturated gain is taken 10 dB.
Figure 2 shows the variations of ER with control power. With control power, ER
increases and becomes maximum at 0.3 mW, and then becomes almost constant
above 9 dB. The ER is plotted up to 1mW of control power beyond which it shows
decrease.
169
Case 3: When A = 1 and B = 0’, only pump signal is present and the output
Q of the QDSOA becomes high and output P becomes low (as no probe signal
is present there), i.e., P = 1 and Q = 0.
Case 4: When both the inputs A and B becomes ‘1’ both pump & probe signals are
present and the output Q of the QDSOA becomes low and output P is high, i.e.,
P = 1 and Q = 0.
3 Modeling and Results of Simulations
For modeling and simulations, the QDSOA rate equations and the parameters are
used from Dimitriadou et al. [1].
∂ N
∂t
=
J
eL w
−
N (1 − h)
τ w2
+
N Q
τ 2w L w
−
N
τ w R
(1)
∂h
∂t
= −
h
τ 2w
−
N (1 − h)L w
τ w2 N Q
+
(1 − f )h
τ 21
−
f (1 − h)
τ 12
(2)
∂ f
∂t
=
(1 − f )h
τ 21
−
f (1 − h)
τ 12
+
f
2
τ 1R
−
L w g max (2 f − 1)P
N Q A eff hv
(3)
∂ P
∂z
=
[g max (2 f − 1) − α int ]P
A eff hv
(4)
The values of different parameters are : g max = 14 cm
−1 , α int = 2 cm
−1 , J =
1A/cm
2 , L w = 250 nm, N Q = 5.0 × 10
10 , spontaneous radiative lifetime in the
WL(τ wR) = 0.2 ns, electron relaxation time from the WL to ES(τ w2 ) = 3 ps, electron
relaxation time from ES to GS(τ 21 ) = 0.16 ps, group velocity(V g ) = 8.3 × 10
7 m/s,
escape time (electron) from ES to WL(τ 2w ) = 1 ns, escape time(electron) from GS to
ES(τ 12 ) = 1.2 ps, radiative lifetime (spontaneous) in Quantum Dot(τ 1R ) = 0.4 ns, A eff
= 0.75 μm
2 . The input signals are taken of the form P = P 0 exp [−(t/T F )
2 ], where
P 0 is peak power of control signal, and T F = 0.1 ps. We have analyzed the TAND
gate by calculating extinction ratio (ER) = 10log(P
1
max /P
0
min )dB, contrast ratio
(CR) = 10log(P
1
m /P
0
m )dB, amplitude modulation (AM) = 10log(P
1
max /P
1
min )dB,
Quality factor (Q) = (P
1
m – P
0
m )/(σ 1 + σ 0 ), and relative eye opening (REO) =
[1–(P
0
max /P
1
min )] × 100%, where (P
1
max , P
1
min, P
1
m , σ 1 ) and (P
0
max , P
0
min , P
0
m ,
σ 0 ) are maximum, minimum, average, and standard deviations of 1 and 0 states,
respectively. For all the calculations, the unsaturated gain is taken 10 dB.
Figure 2 shows the variations of ER with control power. With control power, ER
increases and becomes maximum at 0.3 mW, and then becomes almost constant
above 9 dB. The ER is plotted up to 1mW of control power beyond which it shows
decrease.